Module 5: Data Modeling in Power BI
Overview
- Relationships
- DAX Basics
- Star Schema
- Role of Data Modeling in Power BI
Create a model in Power BI
- Open Power BI Desktop. Load the data into Power BI Desktop by connecting to the data sources and importing the data tables.
- In the Model view, you can create relationships between the tables by dragging and dropping fields onto each other.
- Define the cardinality and cross-filter direction for each relationship as needed.
- Use DAX to create calculated columns and measures that enhance your data model.
- Build visualizations on top of your data model in the Report view.
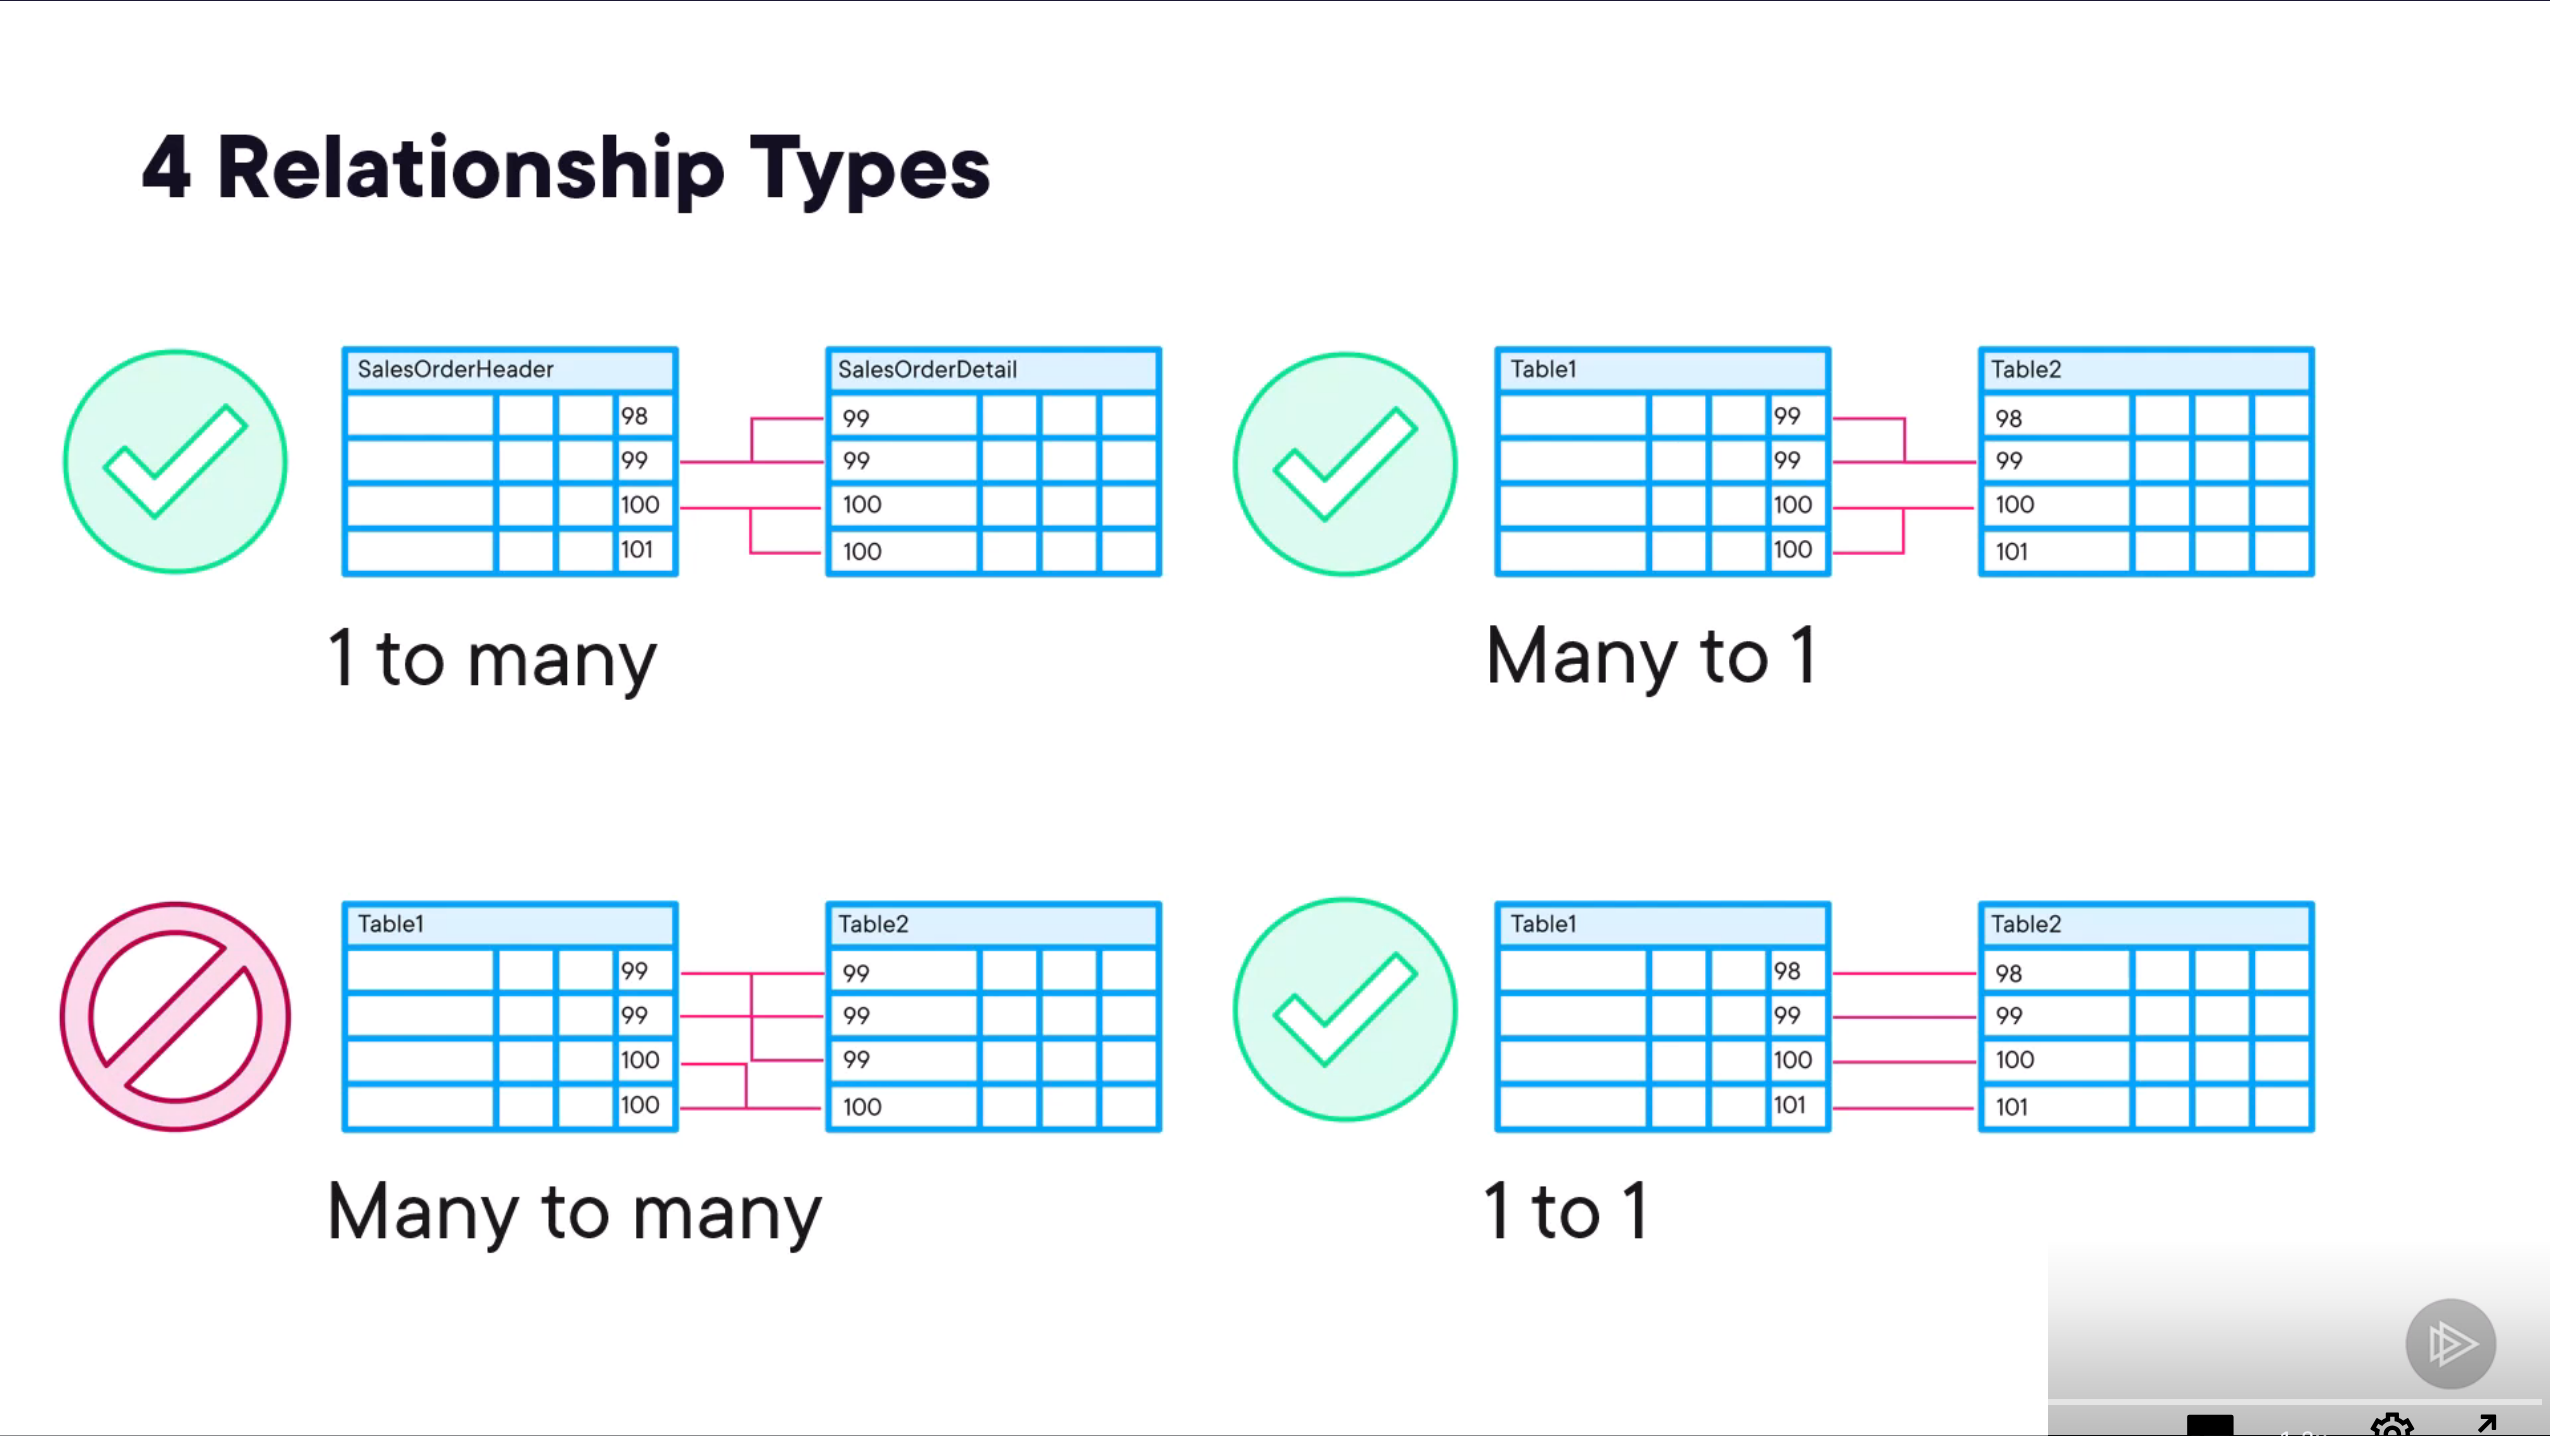
- One to One Relationship - A one-to-one relationship occurs when one record in a table is related to one and only one record in another table. For example, each employee has a unique employee ID.
- One to Many Relationship - A one-to-many relationship is the most common type of relationship in Power BI. It occurs when one record in a table is related to multiple records in another table. For example, a customer can have multiple orders.
- Many to Many Relationship - A many-to-many relationship occurs when multiple records in one table are related to multiple records in another table. This type of relationship requires a bridge table to connect the two tables. NOTE: Avoid Many to Many relationships where possible as they can complicate the model and impact performance. ANOTHER NOTE: Filter propagation direction is important when setting up relationships. It determines how filters applied to one table affect related tables. The default is single direction, but you can set it to both directions if needed (bidirectional).
Active vs inactive relationships
- Active Relationship - An active relationship is the primary relationship between two tables that Power BI uses by default when creating visualizations and performing calculations. There can only be one active relationship between two tables at a time.
- Single line relationship indicator
- Inactive Relationship - An inactive relationship is a secondary relationship between two tables that is not used by default. You can have multiple inactive relationships between two tables, but only one can be active at a time. Inactive relationships can be activated in DAX calculations using the USERELATIONSHIP function.
- Dashed line relationship indicator
Manage Relationships
You can click on the Manage Relationships button in the Model view to open the Manage Relationships dialog box. This dialog box allows you to view, edit, and delete relationships between tables in your data model.
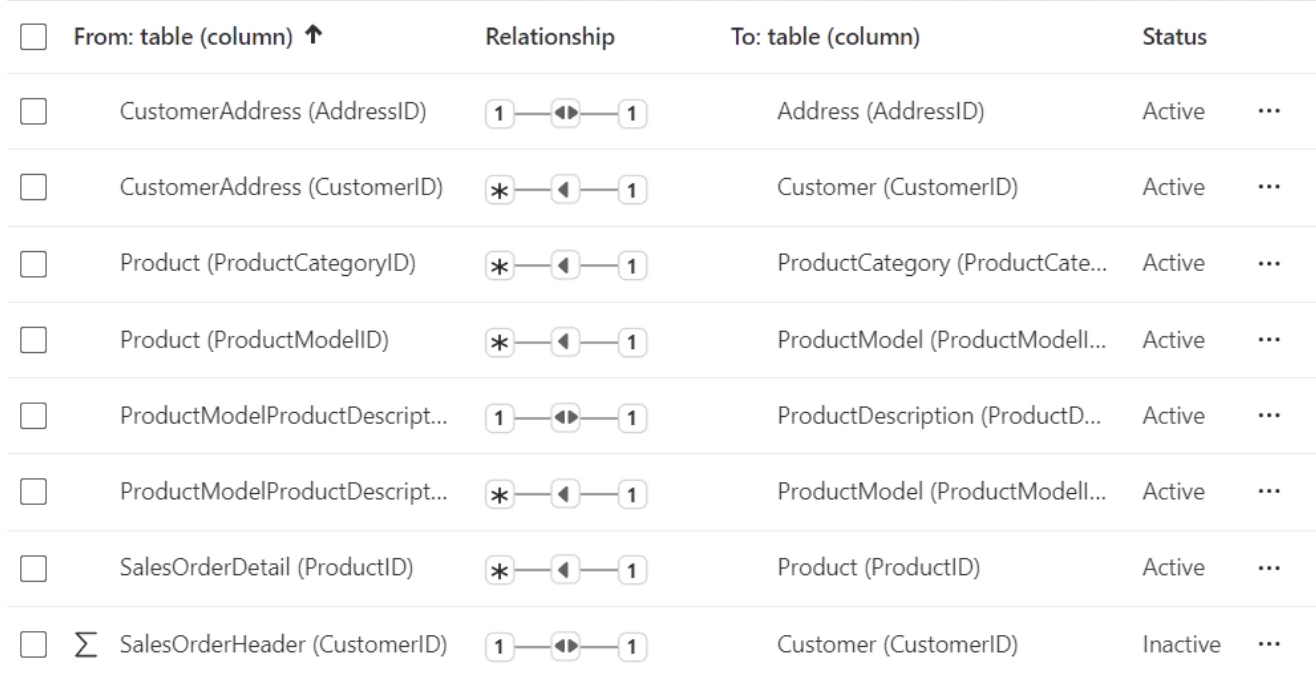
You can click new relationship to create a new relationship between two tables. In the Create Relationship dialog box, you can select the tables and columns that you want to relate, as well as define the cardinality and cross-filter direction for the relationship.
You can also edit existing relationships by selecting them in the Manage Relationships dialog box and clicking the Edit button. This will open the Edit Relationship dialog box, where you can modify the relationship settings as needed.
Star Schema vs Snowflake Schema
-
Star Schema - A star schema is a type of data model that consists of a central fact table surrounded by dimension tables. The fact table contains the measures and metrics that you want to analyze, while the dimension tables contain the attributes and characteristics that you want to use to slice and dice the data. Star schemas are easy to understand and navigate, making them a popular choice for data modeling in Power BI.
-
Snowflake Schema - A snowflake schema is a more complex type of data model that normalizes the dimension tables into multiple related tables. This can help reduce data redundancy and improve data integrity, but it can also make the model more difficult to understand and navigate. Snowflake schemas are less commonly used in Power BI, but they can be useful in certain scenarios where data normalization is important.
-
Fact Table - A fact table is a central table in a star schema that contains the measures and metrics that you want to analyze. Fact tables typically have a large number of rows and a small number of columns, and they are often denormalized to improve query performance.
-
Dimension Table - A dimension table is a table in a star schema that contains the attributes and characteristics that you want to use to slice and dice the data. Dimension tables typically have a small number of rows and a large number of columns, and they are often denormalized to improve query performance
Sometimes you will see things called Dim_ or Fact_ as prefixes to table names. If you have auto relationships enabled, it will then create the relationships based on matching column names and IDs. Be careful with this as it may create relationships you do not want, but this is handy with these types of tables.
Enhance model with DAX
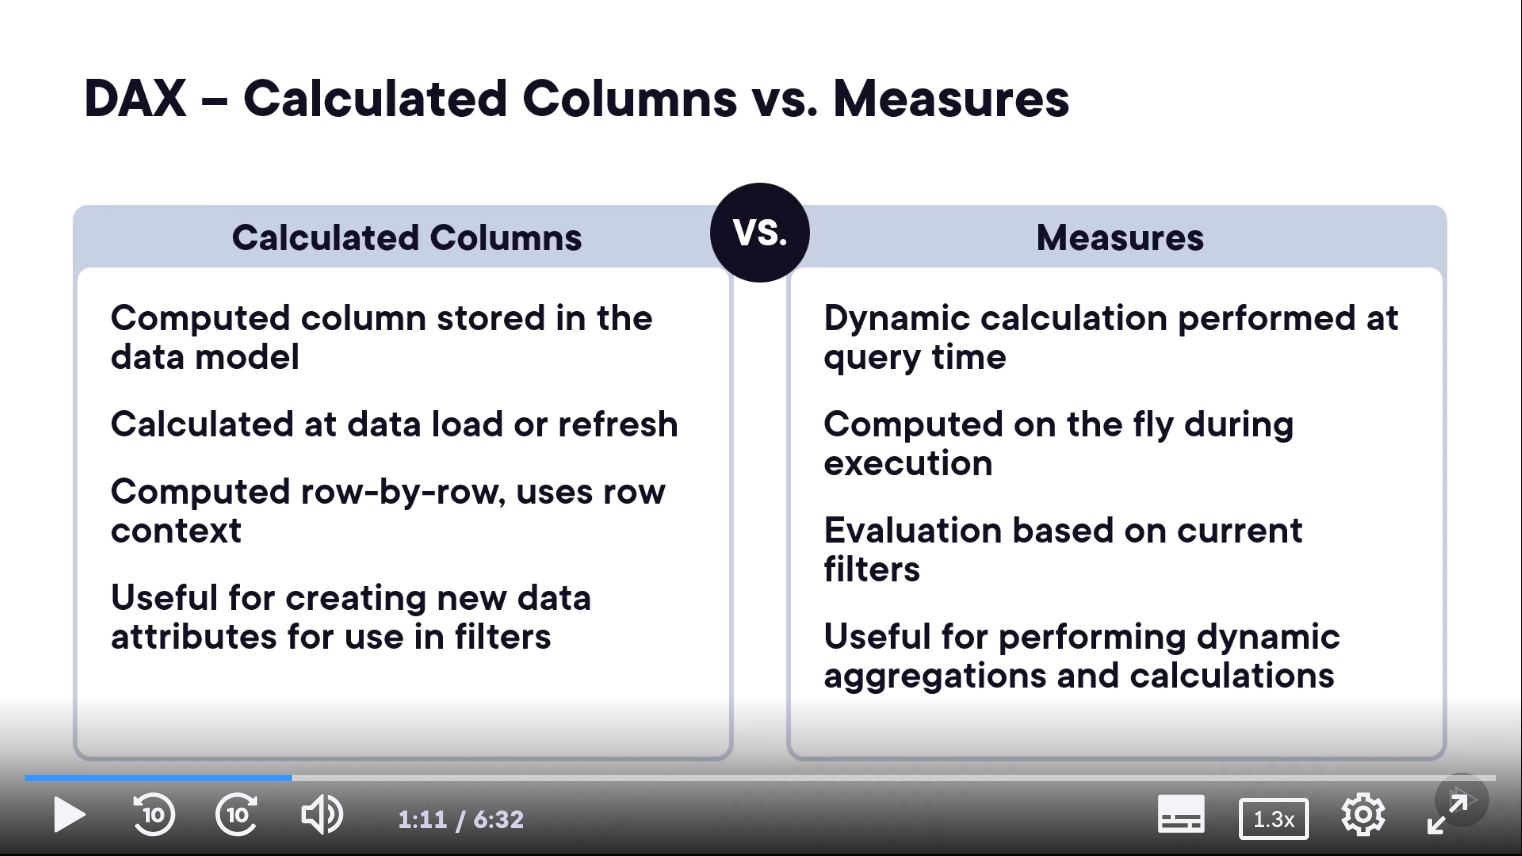
DAX (Data Analysis Expressions) is a formula language used in Power BI to create calculated columns and measures.
Reminder: Measures are calcuations. Calculated columns are new columns added to a table.
DAX uses row and filter context to perform calculations. Row context refers to the current row being evaluated, while filter context refers to the filters applied to the data model.
This makes DAX crucial for enhancing your data model in Power BI, as it allows you to create custom calculations and aggregations that can provide deeper insights into your data.
Creating Calculated Columns and measures
To create a calculated column in Power BI, you can use the following steps:
- In the Data view, select the table where you want to add the calculated column.
- Click on the New Column button in the Modeling tab.
- Enter the DAX formula for the calculated column in the formula bar.
- Press Enter to create the calculated column.
To create a measure in Power BI, you can use the following steps:
- In the Data view, select the table where you want to add the measure.
- Click on the New Measure button in the Modeling tab.
- Enter the DAX formula for the measure in the formula bar.
- Press Enter to create the measure.
Note: Measures can reference other measures, but calculated columns cannot reference measures. :)
Quick Measure gives you a next next finish creation of a measure based on common calculations.
Role Playing Dimensions
A role-playing dimension is a dimension table that can be used in multiple contexts within a data model. This reduces storage space.
For example, a Date dimension table can be used to represent different date attributes such as Order Date, Ship Date, and Due Date in a sales data model.
Hierarchies in Power BI
Hierarchies in Power BI allow you to create a structured relationship between different levels of data. This is particularly useful for drilling down into data and analyzing it at different levels of granularity.
For example, you might have a hierarchy that includes Country > State > City. This allows users to drill down from the country level to the state level and then to the city level, providing a more detailed view of the data.
To create a hierarchy in Power BI, you can use the following steps:
- In the Data view, select the table where you want to create the hierarchy.
- Click on the New Hierarchy button in the Modeling tab.
- Drag and drop the fields you want to include in the hierarchy into the hierarchy container.
- Arrange the fields in the desired order.
Model Optimization Tips
- Use Star Schema - Whenever possible, use a star schema for your data model. This will improve query performance and make it easier to understand and navigate.
- Use correct Data Types - Ensure that each column in your data model has the appropriate data type. Using the wrong data type can lead to performance issues and incorrect results.
- Minimize Relationships - Avoid creating unnecessary relationships between tables. Each relationship adds complexity to the model and can impact performance.
- Use Appropriate Cardinality - Ensure that the cardinality of each relationship is appropriate for the data. Using the wrong cardinality can lead to incorrect results and performance issues.
- Optimize DAX Calculations - Write efficient DAX calculations by minimizing the use of complex functions and avoiding unnecessary calculations.
- Reduce Data Volume - Limit the amount of data loaded into the model by filtering out unnecessary rows and columns.
- Use Aggregations - Create aggregation tables to pre-calculate summary data, which can improve query performance for large datasets.
- Split wide columns - date and time columns into separate date and time columns to reduce the size of the data model.
- Use query folding - when connecting to data sources to push data transformations back to the source system, reducing the amount of data loaded into Power BI.
TIP: Bring in the data that you need, not all the data you have. TIP: Some transformations stop query folding. Move the steps that break query folding to the end of the query.