Lab 1: Transform Data in Power BI with Power Query
Process
-
Open Power BI Desktop. From the Select a data source page, choose Excel workbook.
-
Browse for the folder by entering the following: File name: C:\Users\Public\Desktop\PowerBI_Datasets
-
Then, select PC_Sales_2021
-
On the navigation, check PC_Sales_2021 on the right panel to use this dataset and select Transform Data.
-
This will automatically launch Power Query Editor and allow you to perform various data transformations. Check if any unnecessary columns are imported. It is a recommended practice to keep only the data that provides business value to your Power BI report.
-
Review the table and remove unnecessary column. Right-click on Column6 from the table and select Remove.
-
Note: Choosing a proper data type is one of the key requirements for an efficient Power BI solution. Generally, you should always check data types for each table column. Sometimes, it might happen that the default data type is not the appropriate one, and you need to manually adjust it.
-
For the Order date column, change the data type from number to Date.
-
Change the name of the query to Fact_Sales_2021
-
Connect and open the Excel file named PC_Products
-
Very often, the source data comes in a form that is not completely suitable for business reporting purposes. Therefore, you need to apply various data transformation techniques to clean and validate the data. Here, you will remove all technical specifications from product names.
-
In the Transform ribbon of the Power Query Editor, find the Extract transformation, and extract the text before the following delimiter in the Product column: “ (“ (blank space and opening bracket)
-
In Power Query Editor, change the query name to Dim_Product
-
In the Home tab of the Power Query Editor, click Close & Apply.
Apply Split Column and Unpivot Transformations
-
Connect and open the Excel file named PC_Managers
-
In Power Query Editor, change the query name to Dim_Manager
-
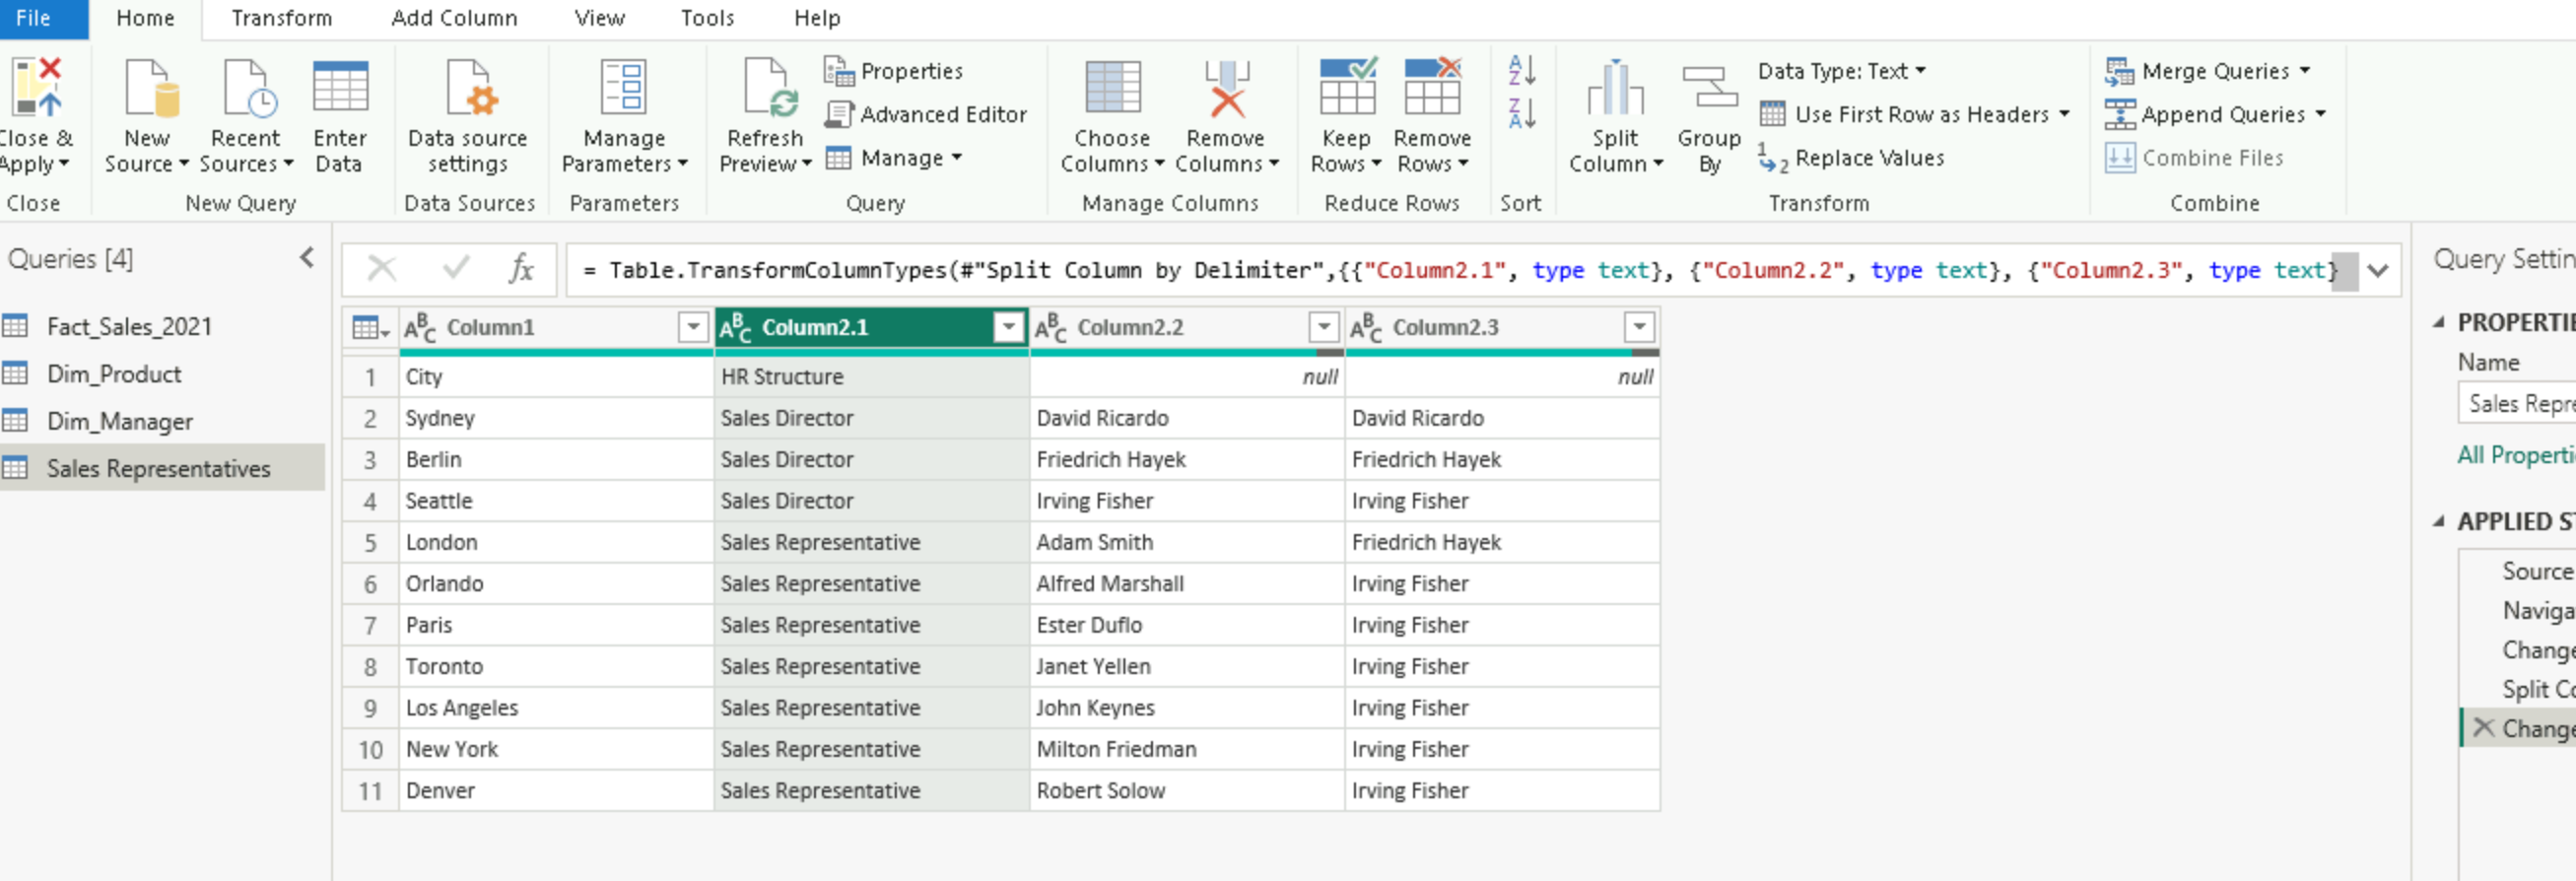
Connect and open the Excel file named PC_Sales_Representatives
-
Observe how the information in the HR Structure column is displayed - everything is condensed into one column. You need to store this information separately.
-
In Power Query Editor, click on the HR Structure column. In the Transform tab, find the Split Column transformation, and split the column by the delimiter “-” (minus sign).
-
-
Rename newly created columns as follows:
-
HR Structure.1 -> Position
-
HR Structure.2 -> Employee
-
HR Structure.3 -> Manager Code:

Close and apply the changes. 11. Connect and open the Excel file named Sales_Targets
-
Observe the structure of the table that shows region key values displayed as columns.
-
In Power Query Editor, while keeping the CTRL key pressed, select the product key and Date columns, right-click, and then choose to Unpivot other columns
-
Rename the Attribute column to Region key, and the Value column to Sales Target
-
In the Home tab of the Power Query Editor, click Close & Apply.
Combine Multiple Queries and Group Data
-
-
In the Get Data ribbon, locate the Folder option, browse for the Sales folder in the C:\Desktop\LAB_FILES\Datasets, and choose to transform this data in Power Query Editor
-
Change the name of the query to Fact_Sales_2018_2020
-
Right-click on the first column on the left (Content), choose Remove Other Columns transformation, and expand the Content column header by clicking on the double-arrow icon in the top right corner of the column name
-
Change the data type of the Order date column to Date (hint: use Add new step option)
-
Analysis: Combining data from multiple tables is one of the most common requirements when designing Power BI models. There are two main options to combine the data:
-
Append - adds new rows to the existing table (makes table longer)
-
Merge - adds new columns to the existing table (makes table wider)
-
In this task, you will use the Append transformation to combine the data from the Fact_Sales and Fact_Sales_2018_2020 tables
-
Click on the Fact_Sales table, and choose Append Queries transformation. As a table to append, select Fact_Sales_2018_2020.
-
Please observe that tables have the same structure (the same number of columns and the same data types). Your base table (Fact_Sales) just became three years “longer,” to include records from 2018 to 2020.
-
Since you now have all years’ data in a single table (Fact_Sales), you don’t need to load Fact_Sales_2018_2020 anymore. You will disable the loading of this table to avoid loading duplicated records and end-user confusion.
-
Right-click on the Fact_Sales_2018_2020 table and uncheck the Enable load option
-
Note: In this task, you will use the Merge transformation to combine the data from the Dim_Region and Sales_Representatives tables.
-
Connect and open the CSV file named PC_Regions
-
Change the name of the query to Dim_Region
-
Click on the Dim_Region table, and choose Merge Queries transformation. As a table to merge, select Sales_Representatives. Please observe that tables have a common column (City).
-
Expand the Sales_Representatives column, and select the Position, Employee, and Name columns. Make sure to uncheck the Use original column name as prefix option. Your base table (Dim_Region) just became three columns “wider,” to include columns from the Sales_Representatives table
-
Click on the arrow in the right corner of the Region ID column, and from the drop-down menu, sort the records in ascending order
-
Since you now have all data in a single table (Dim_Region), you don’t need to load Sales_Representatives anymore. You will disable the loading of this table to avoid loading duplicated records and end-user confusion.
-
Right-click on the Sales_Representatives table and uncheck the Enable load option
-
The common business requirement is to take a look at aggregated data. The most convenient way to aggregate the data in Power Query is by using the Group By transformation. In this case, you will aggregate the order quantity value per date.
-
Right-click on the Fact_Sales query, and choose Duplicate. Rename the duplicated query to Sales_by_date
-
In the Transform tab, choose Group By transformation, and in the dialog window, configure the transformation as follows:
-
Group by -> Order date
-
New column name -> Sales
-
Operation -> Sum
-
Column -> Order quantity
-
In the Home tab of the Power Query Editor, click Close & Apply. Success!