3. Connecting Data
Connect, Shape and Load Data Front end vs backend
Backend - Power Query Editor - ETL
- connect and extract using pre-built connectors
- profile and QA the data to clean and prepare it for modeling
- transform and shape tables
- merge or append queries
- advanced transformations
Frontend - Data, model, report views
- build data models
- add calculations and columns
- design reports
- publish and share to Power BI service
Types of connectors
Get Data
Excel, SQL server, data, web, OData feed, folder (all of the files in the folder).
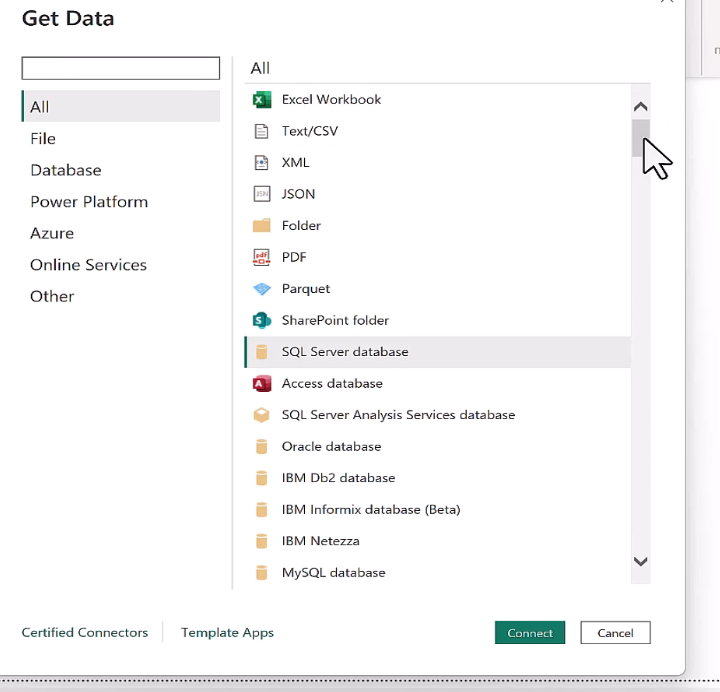
Can also create a blank query if you understand M Code.
All of what you do in Power BI can work with any of these sources
Load - loads directly into PBI Transform - Query editor
- Make a small change - like update the name:
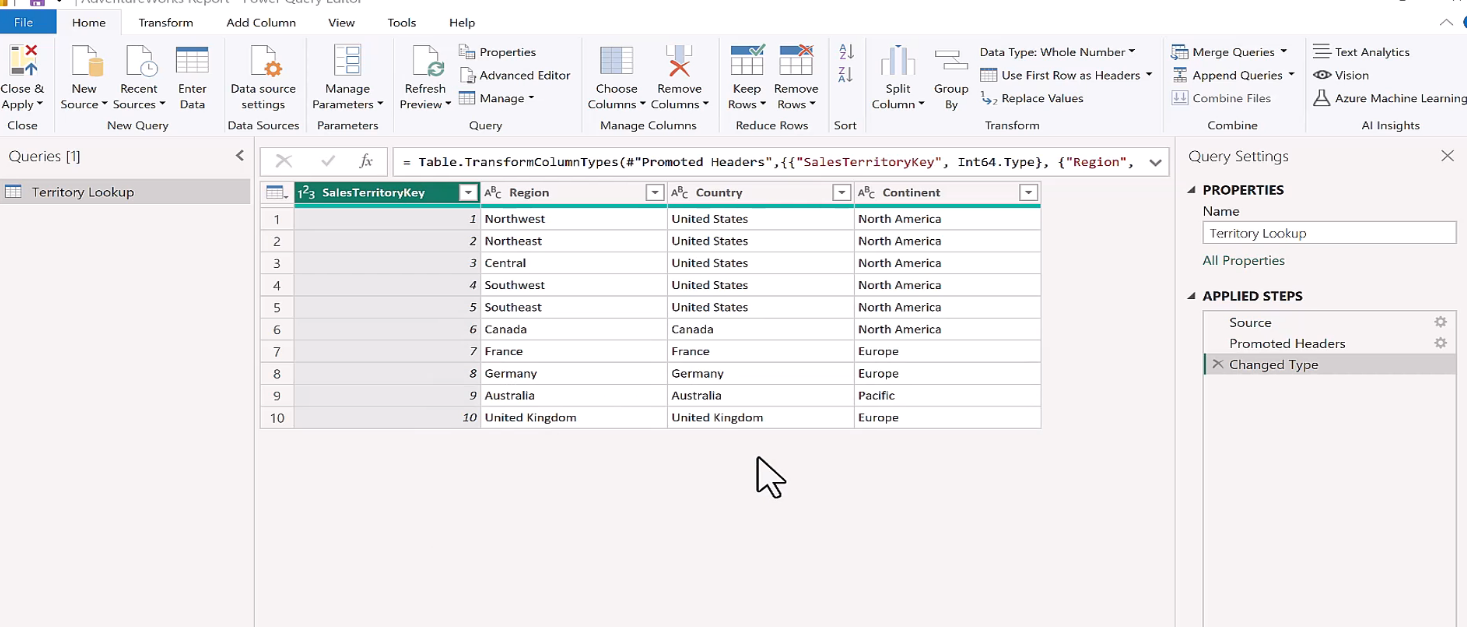
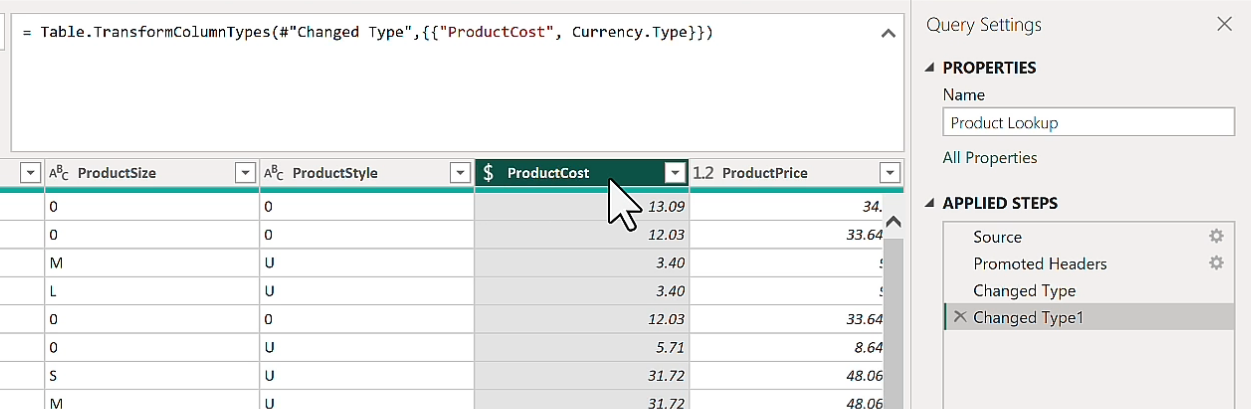
Power Query Editor
Formula bar = M Code = VBA Macros
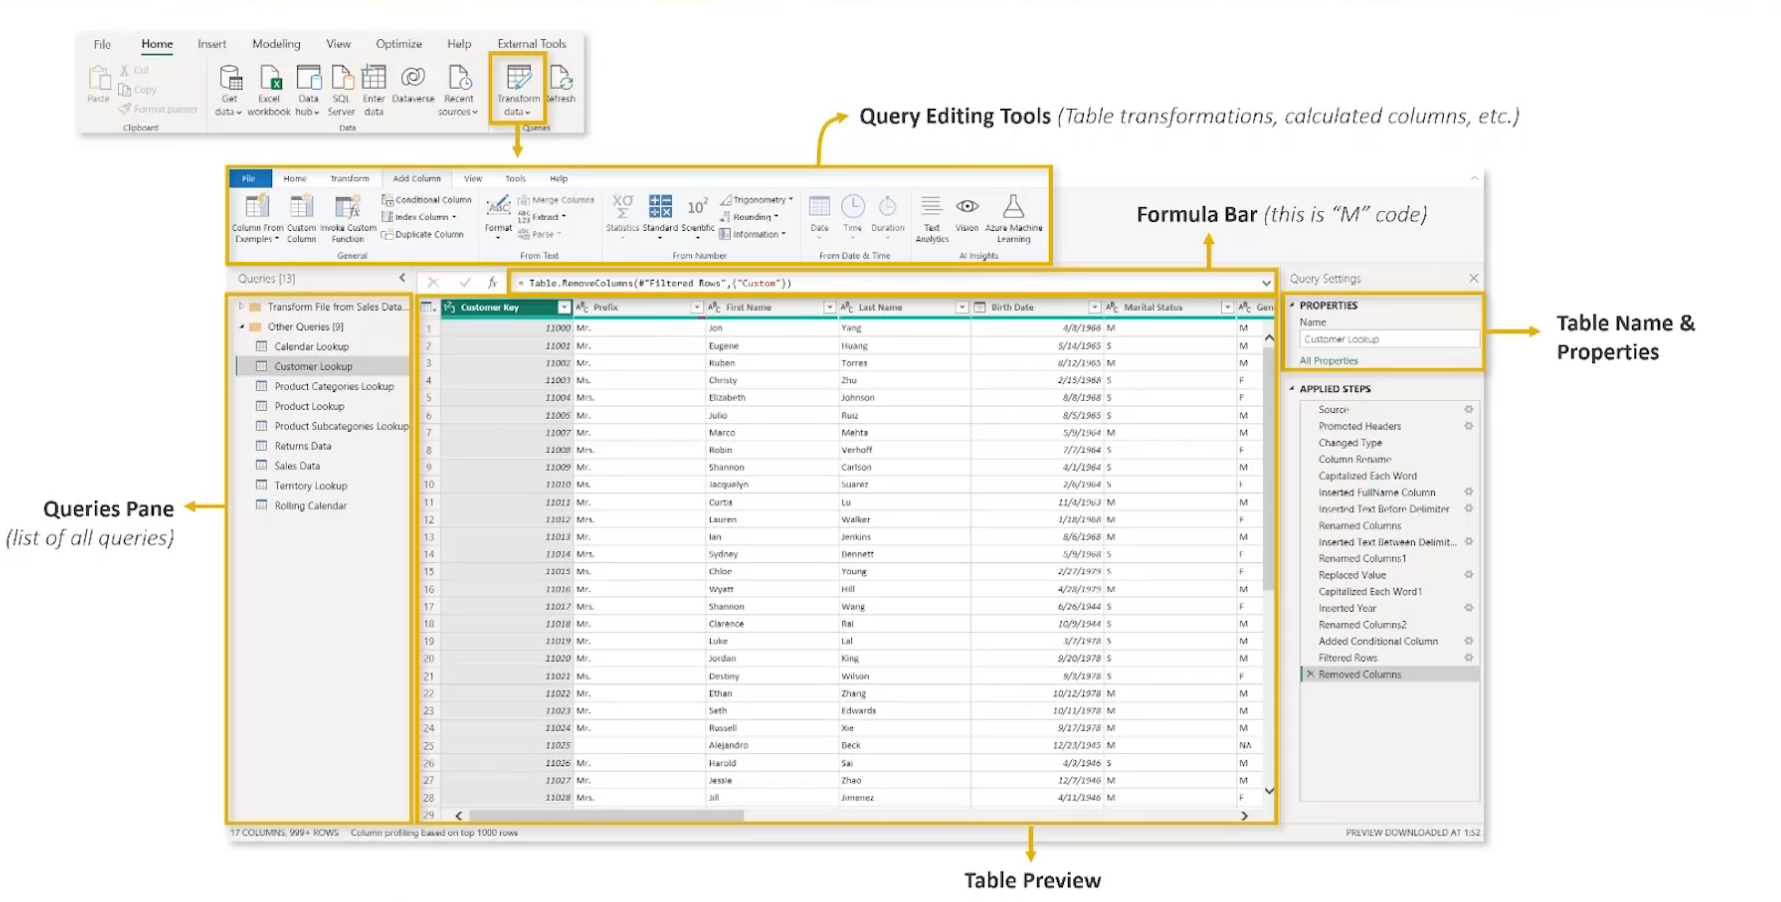
Note: Create your column names to something readable "Business Unit" would be better than "businessUnit"
3 main tabs
- Home - General Settings and common transformation tools
- Transform - tools to modify existing columns
- Add Column - create new columns using rules, operations, calculations, dates, etc.
Basic Table Transformations
PBI just assumes things based on the first 200 rows about the data
It makes headers, column types (like it knows what currency may be), integers, text, etc.
Text Tools
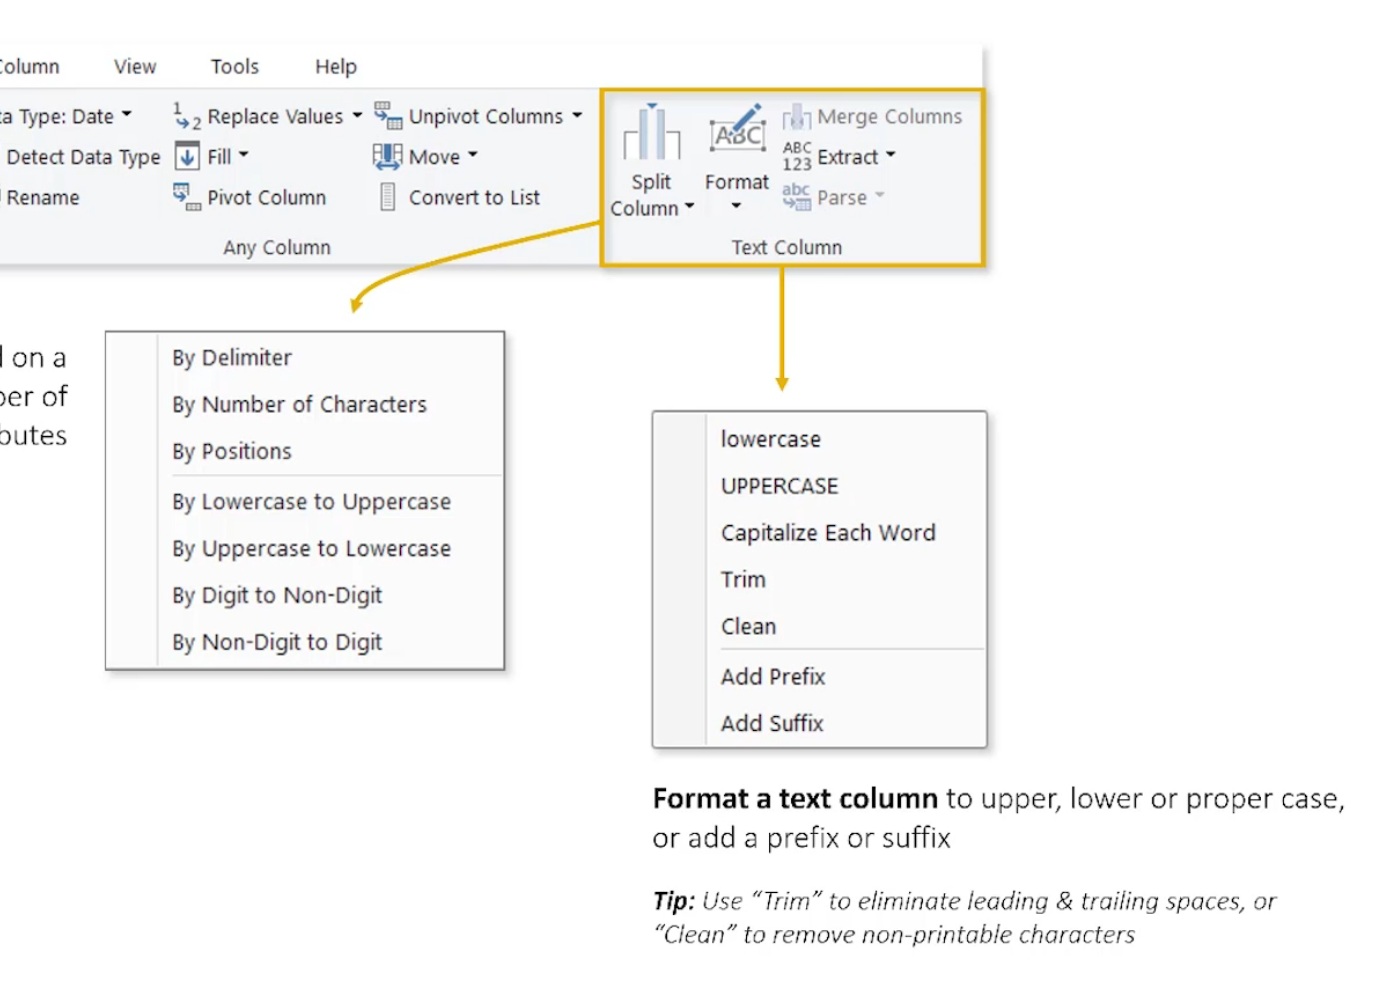 Trim and clean are huge - trailing spaces or non printable characters.
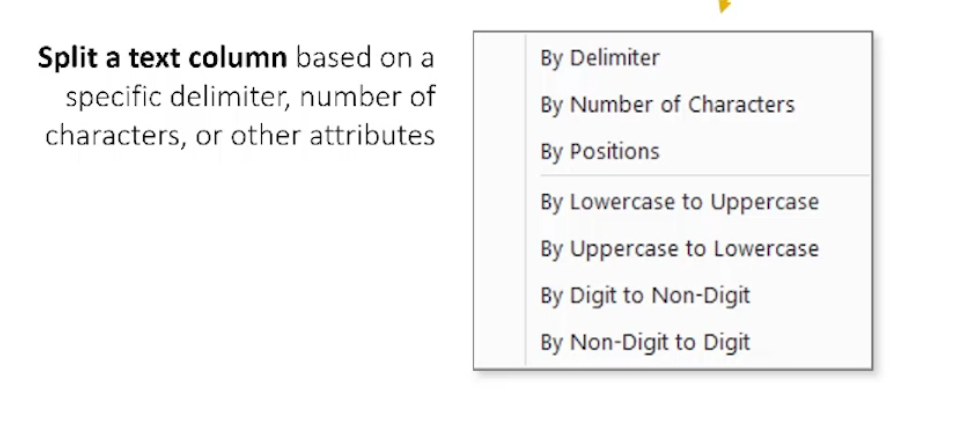
Delimiters:
Difference between Transform and Add Column
- Transform - edit and overwrite the column
- Add Column - create a new column with the new data
Select the columns in order that you want to combine into a new column. Mr. Bilbo Baggins isn't the same if you combine it wrong like Baggins Mr. Bilbo.
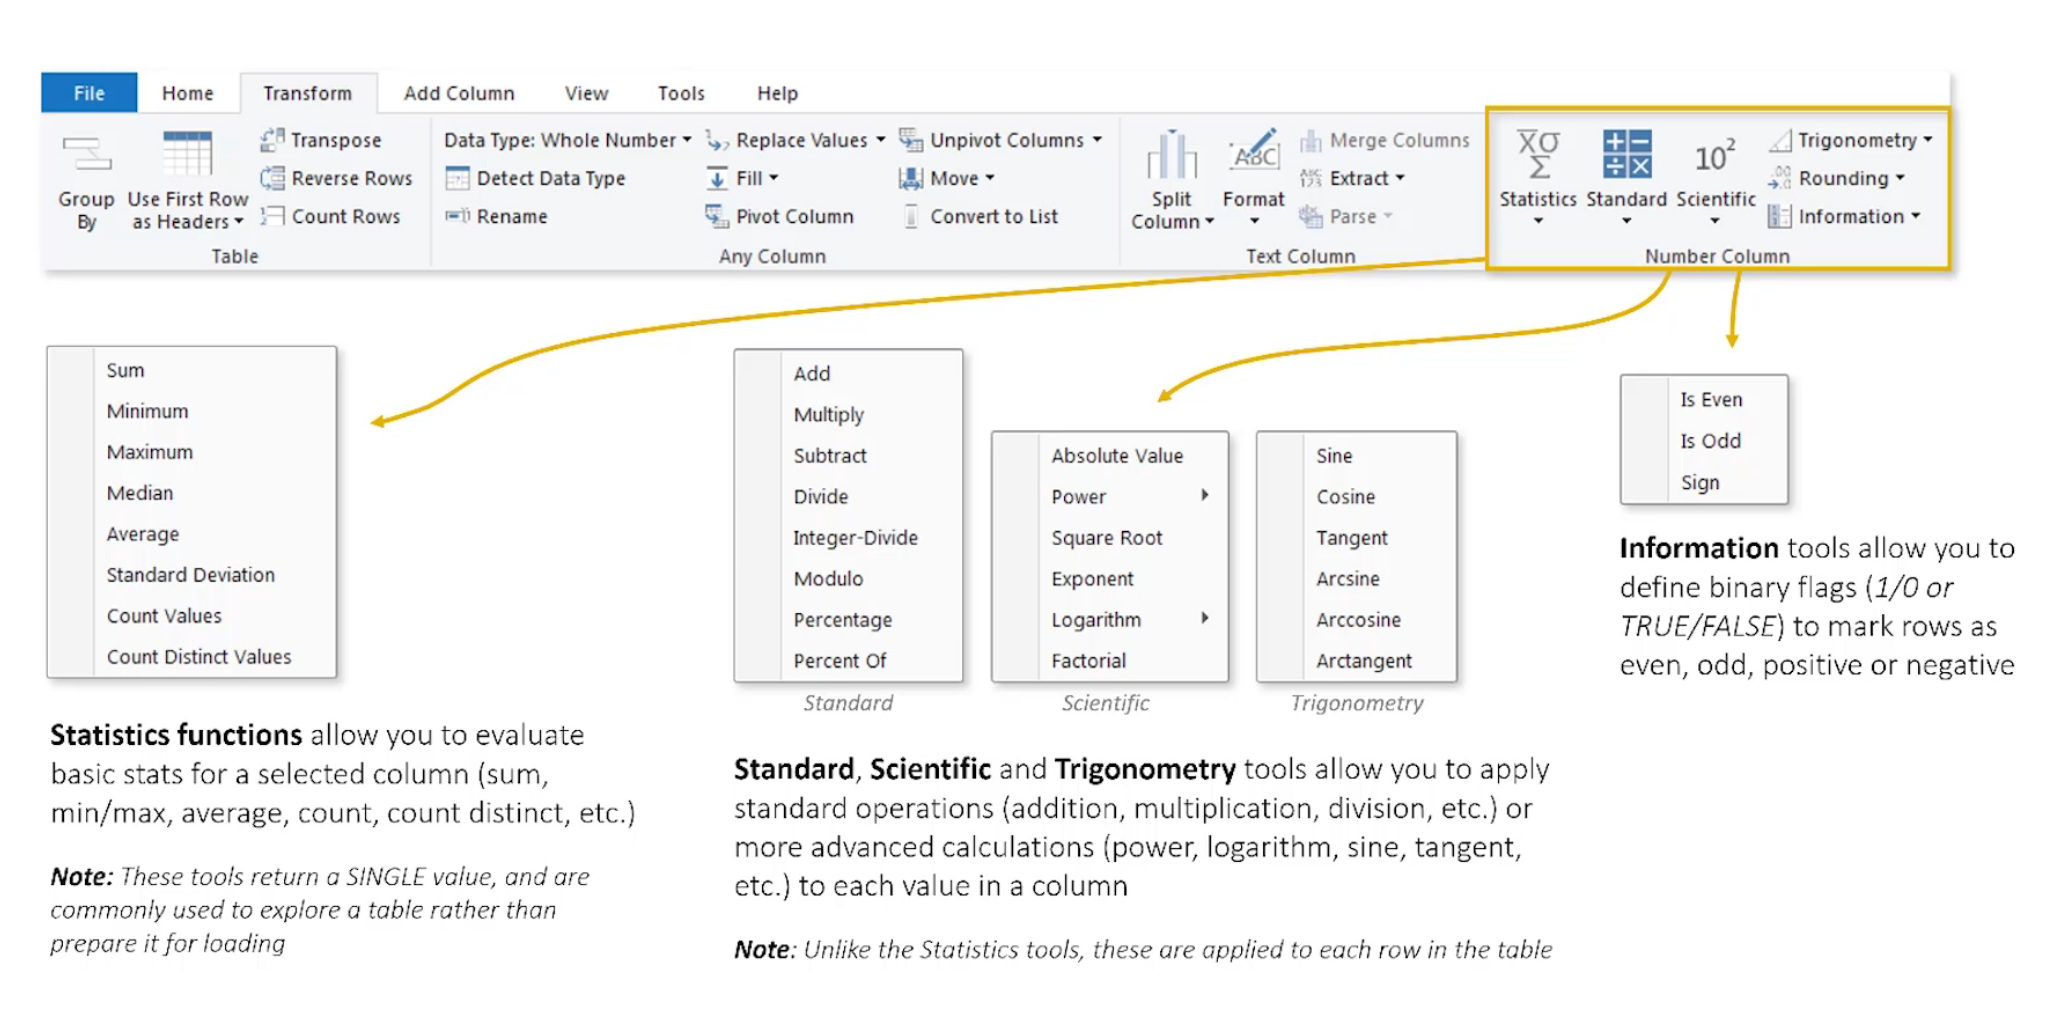
Numerical tools
Yay trigonometry.
Rolling Calendar
Automatically updating calendar over time.
Index columns
Start with 0 or 1 and increment to create primary keys
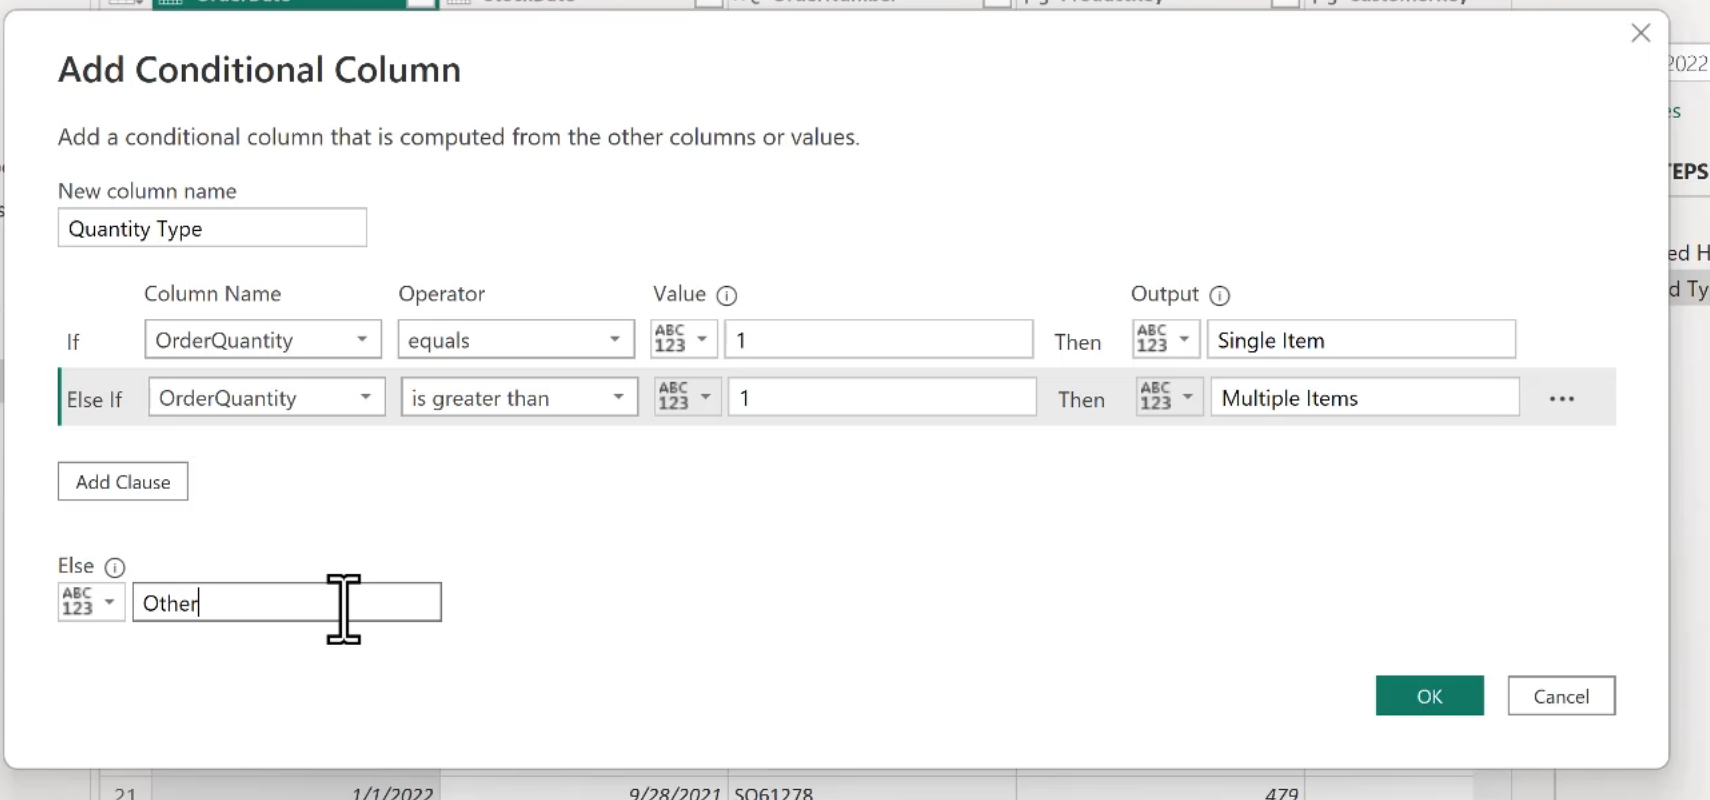
Conditional Columns
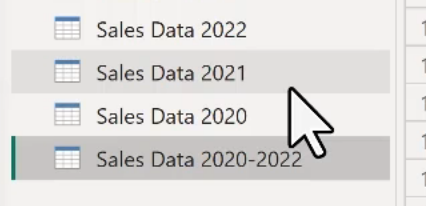
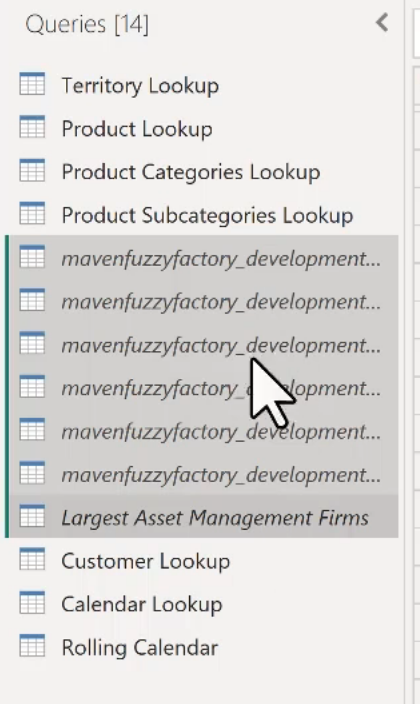
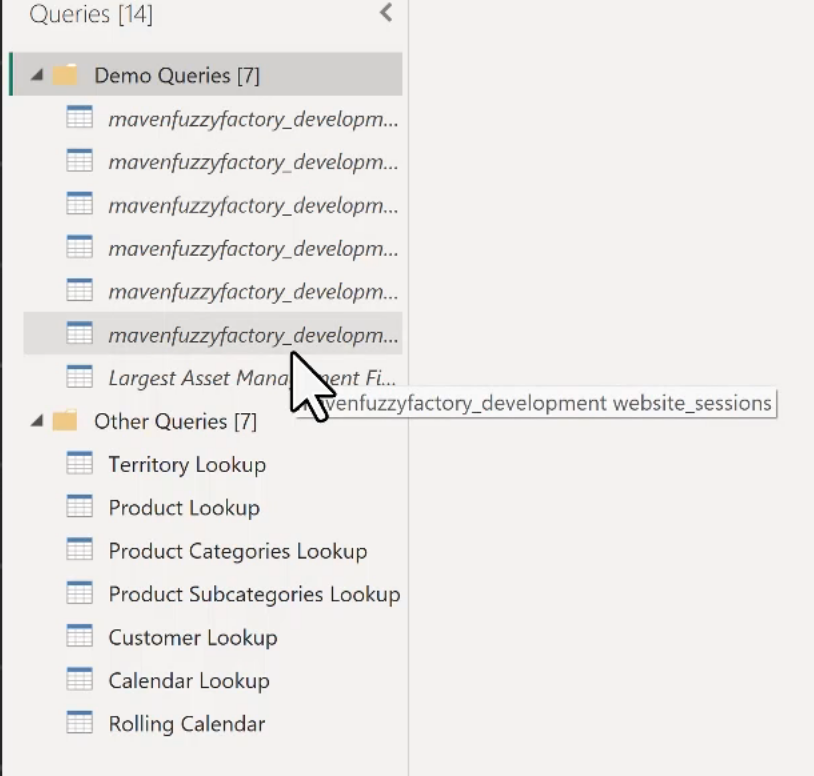
Group Queries
Select a bunch of them and create the group.
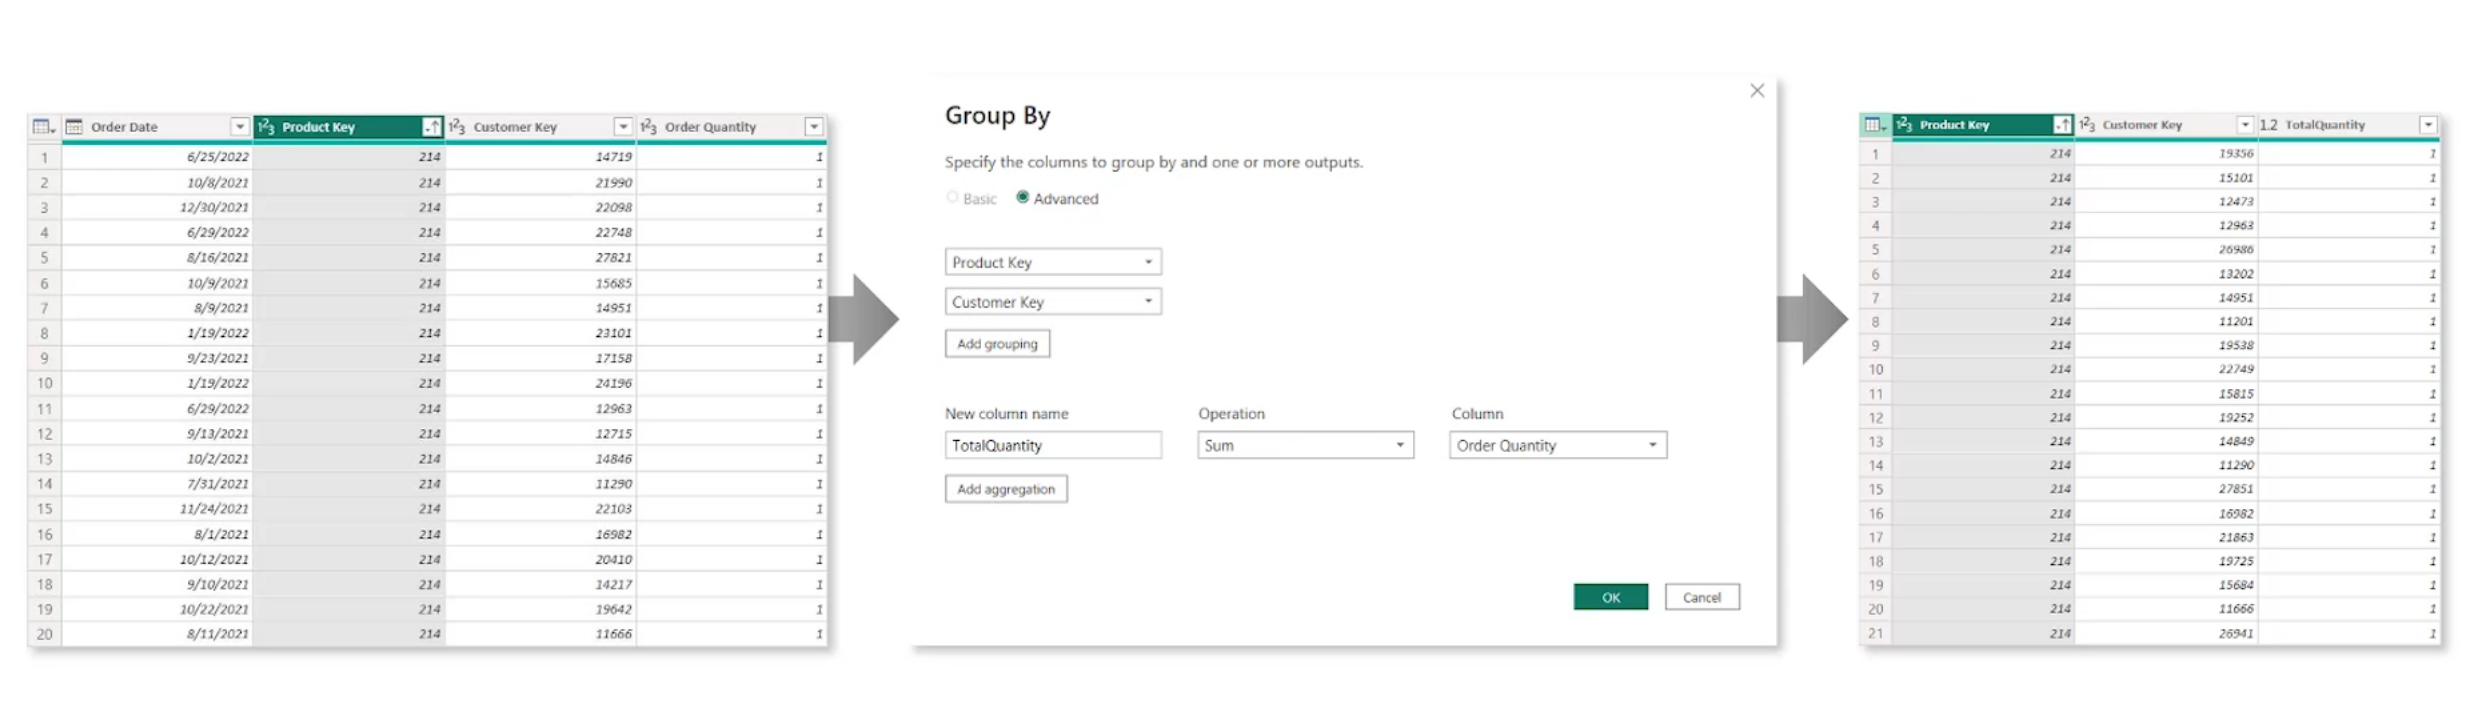
From this:
To this:
Power Query Best Practices
Power Query runs through all the steps every time it loads or refreshes.
-
if you have a bunch of adds, moves, delete steps or things that you changed to "undo" something, it is best to just go back and clean up those steps.
-
good to have a catch all or error handling.
Calculated Column Best Practices
- Table Transformations and column calculations should ideally happen as close to the original data source as possible.
Order of speed:
- Data Source
- Power Query
- Power BI front end
- Published reports
Note: Yes, Power Query is faster than the Power BI front end due to the Vertipack engine.
Grouping and Aggregating Data
Group by - rolling something up into a higher level summary
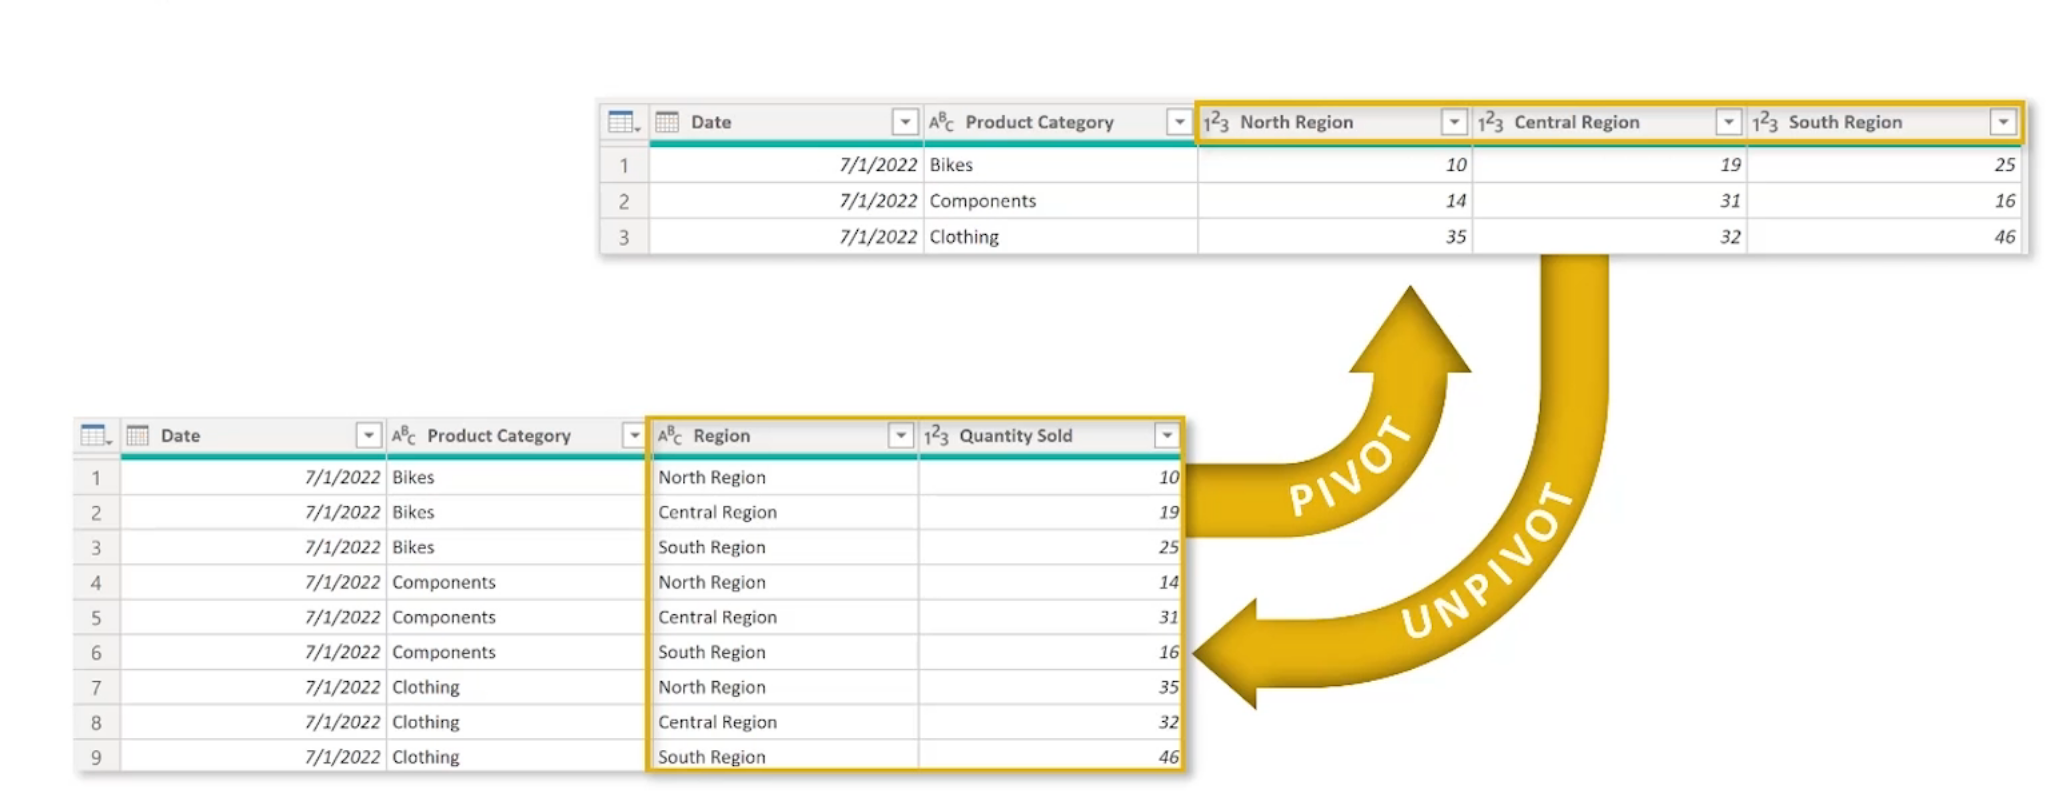
Pivoting and Unpivoting Tables
Pivot is turning rows into columns
Unpivoting is turning columns into rows.
Transpose works in a similar way, but does not recognize unique values.
Merging Queries
Like a lookup in Excel Merging adds additional columns to a table. Note: Generally better to keep tables separate
Left outer -> Grabs all of the left
This will add a colum to the end that must be expanded and you'll need to do that before seeing the new columns in the new table - Rename these accordingly
Appending Queries
Concatenating rows from two (or more) tables into a single table - same structure and same data types