Module 12: Identify Patterns, Part 2
Outliers
Sometimes, you may have data points that are significantly different from the rest of your data. These are called outliers. Outliers can skew your analysis and lead to incorrect conclusions if not handled properly. How to handle outliers depends on the context of your data and the goals of your analysis. You may choose to remove them, transform them, or analyze them separately.
Use Clustering
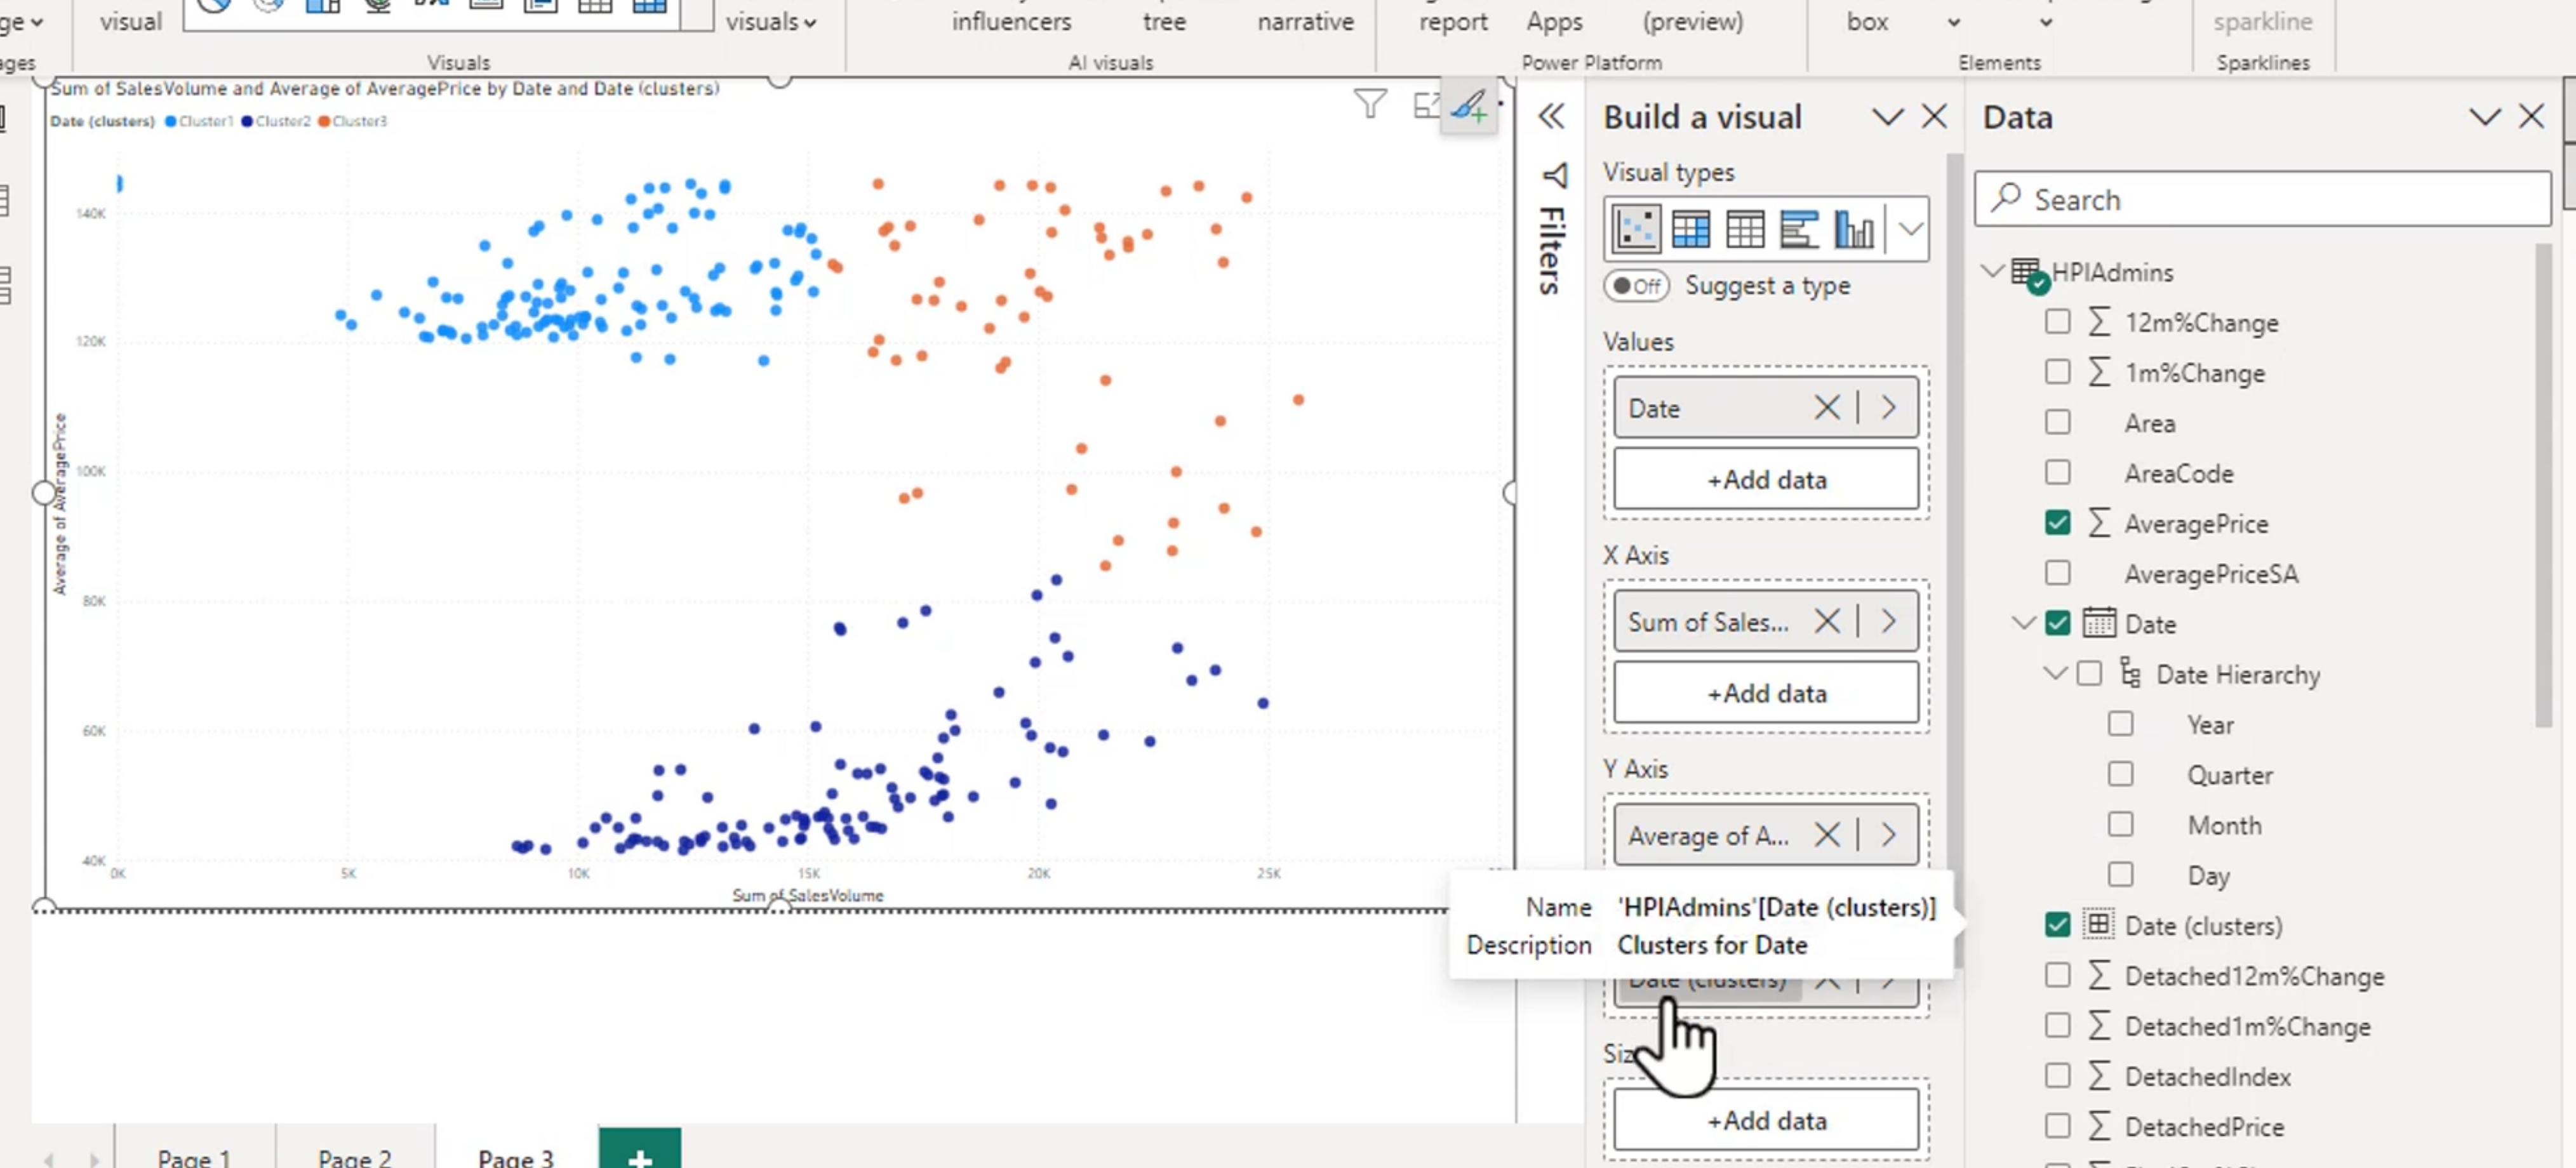
Automatically find clusters is a feature that you can use to identify patterns in your data. Clustering groups similar data points together based on their characteristics, allowing you to see patterns and relationships that may not be immediately apparent. This can be particularly useful for identifying customer segments, market trends, or other patterns in your data.
Use Anomaly Detection
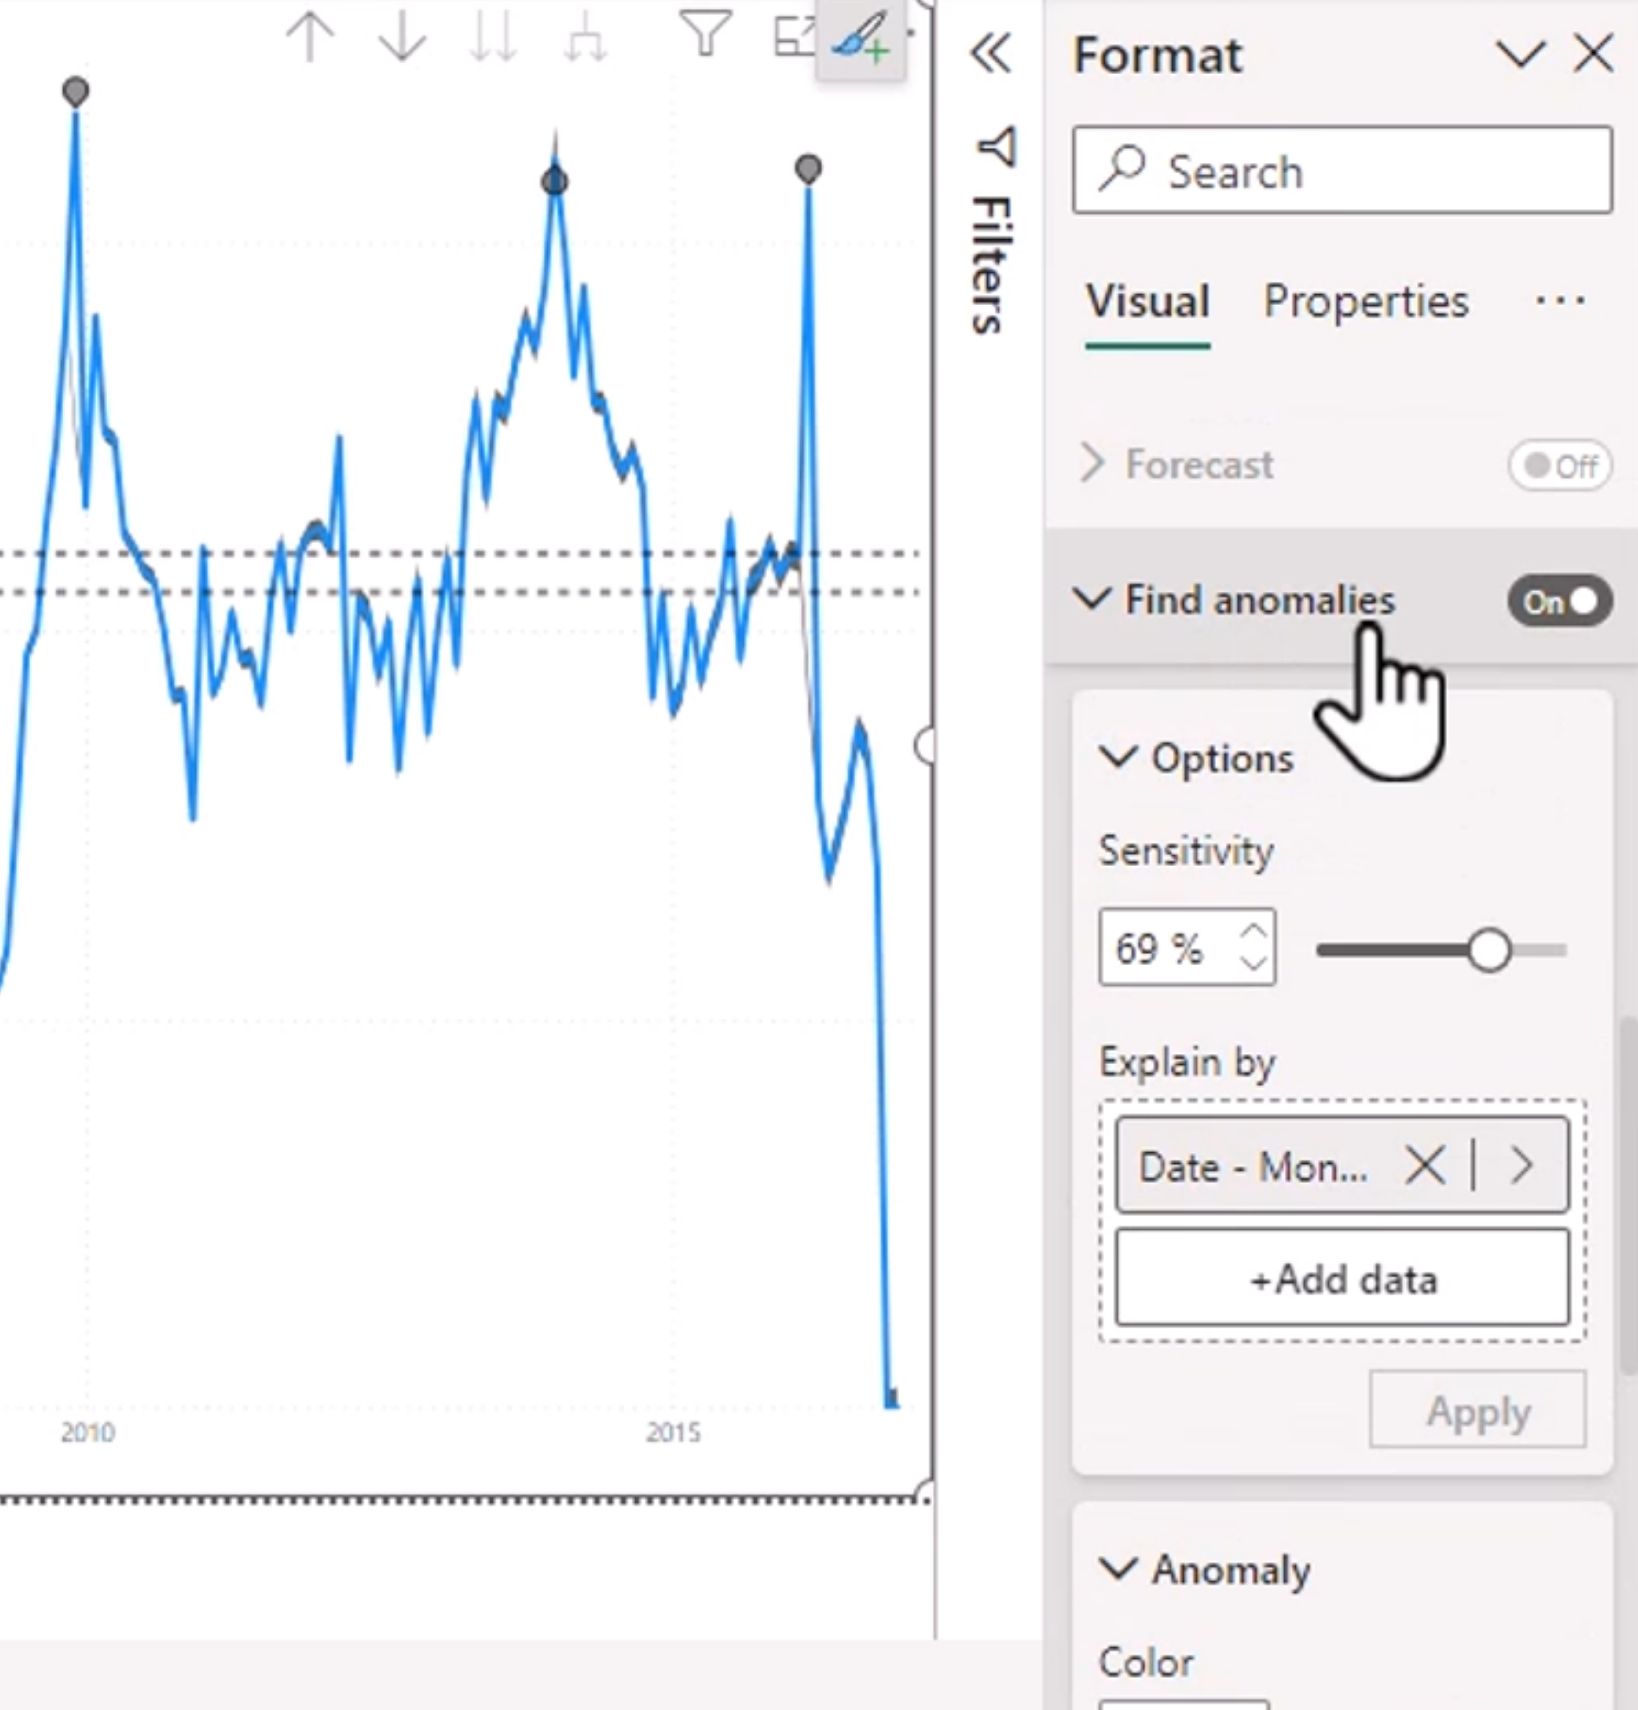
Anomaly detection is a technique used to identify unusual data points that do not conform to expected patterns. This can be useful for identifying potential issues or opportunities in your data. Anomaly detection can be performed using various statistical and machine learning methods, depending on the complexity of your data and the goals of your analysis.
Line chart visuals are the only supported at this time for anomaly detection. You can use the anomaly detection feature in Power BI to automatically identify anomalies in your data and visualize them on a line chart.
Note: You cannot enable anomaly detection while forecasting is enabled. Disable forecasting before enabling anomaly detection.
Sensitivity is a measure of how sensitive the anomaly detection algorithm is to changes in the data. A higher sensitivity will result in more anomalies being detected, while a lower sensitivity will result in fewer anomalies being detected. You can adjust the sensitivity of the anomaly detection algorithm to suit your needs.
Add in a Smart Narrative Visual
These are just called Narratives now. You can right click and hit "Summarize" to add a narrative visual to your report. The narrative visual will automatically generate a summary of your data, highlighting key insights and trends. This can be a useful way to quickly communicate the findings of your analysis to stakeholders.
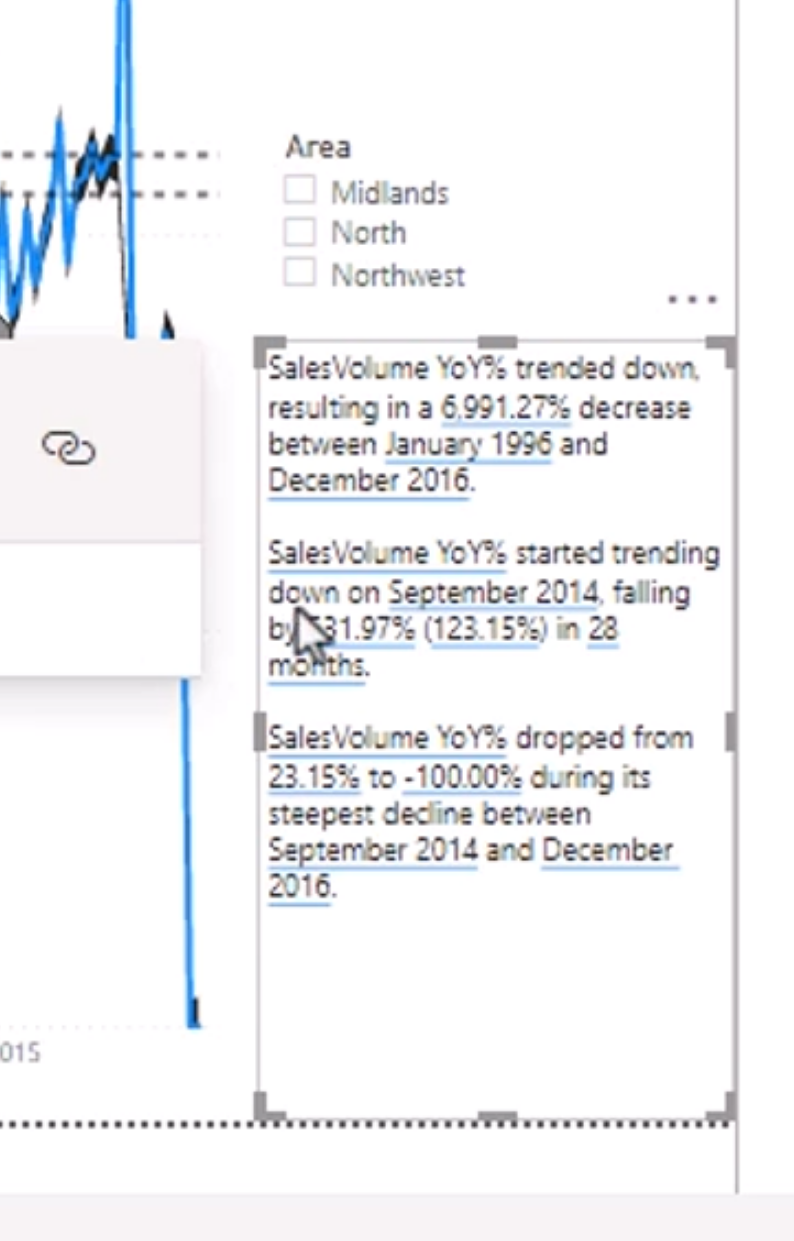
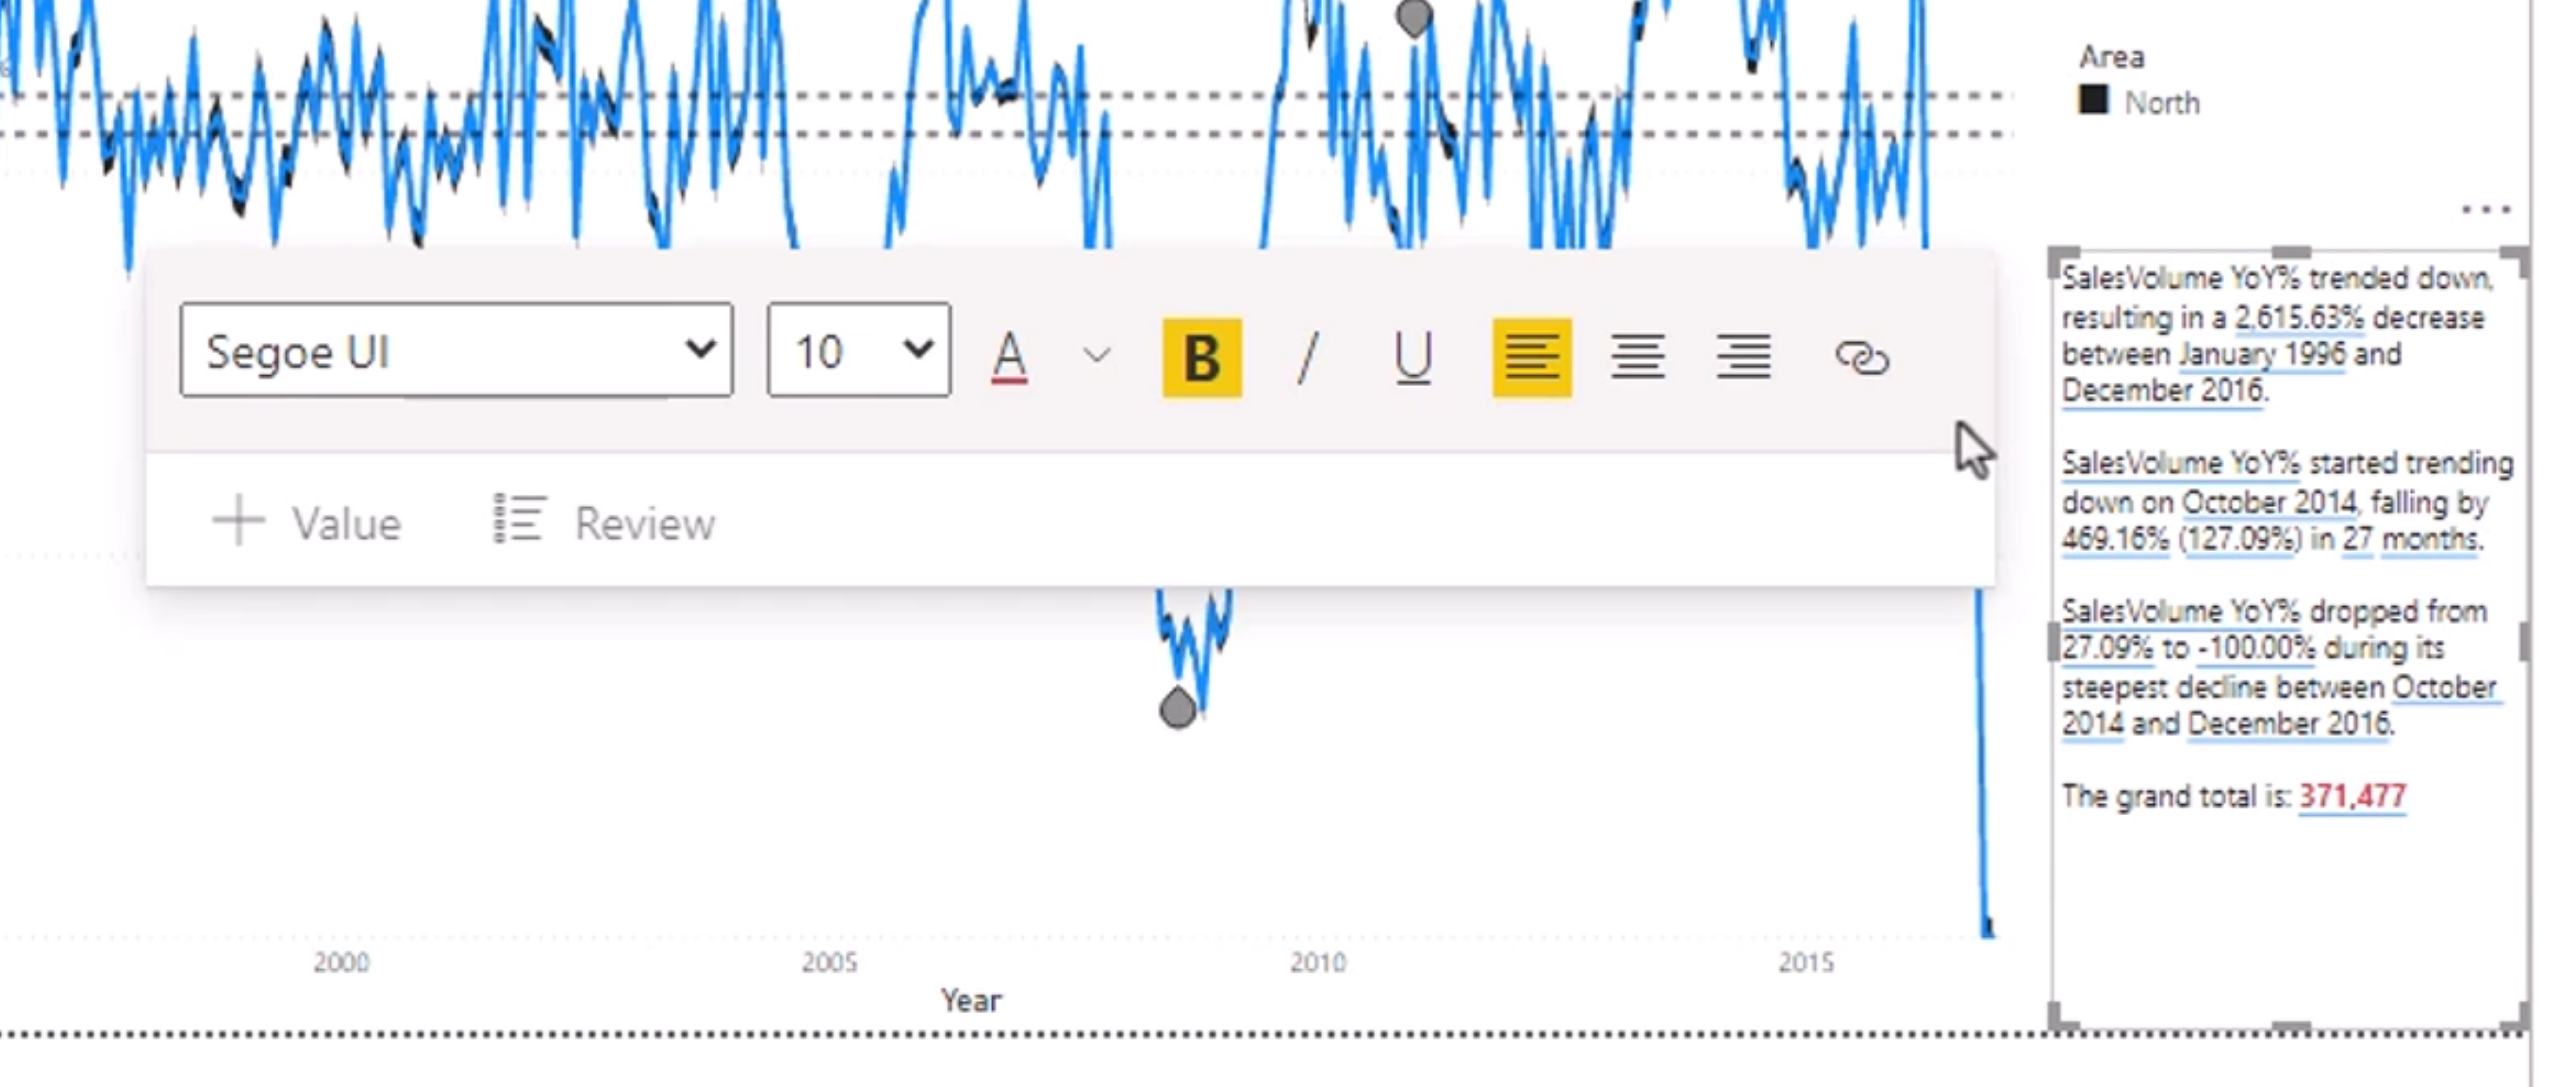
Changing the slicer changes the narrative visual to reflect the filtered data. You can also customize the narrative visual by changing the title, font size, and other formatting options.
We can change the fonts and colors of the narrative visual to match the overall design of our report. This can help to create a cohesive and professional-looking report that is easy to read and understand.
Use Grouping and Binnings
Groups allow you to combine multiple data points into a single group based on shared characteristics. This can be useful for simplifying your analysis and identifying patterns in your data. You can create groups based on categorical or numerical data, and you can also create nested groups to further refine your analysis.
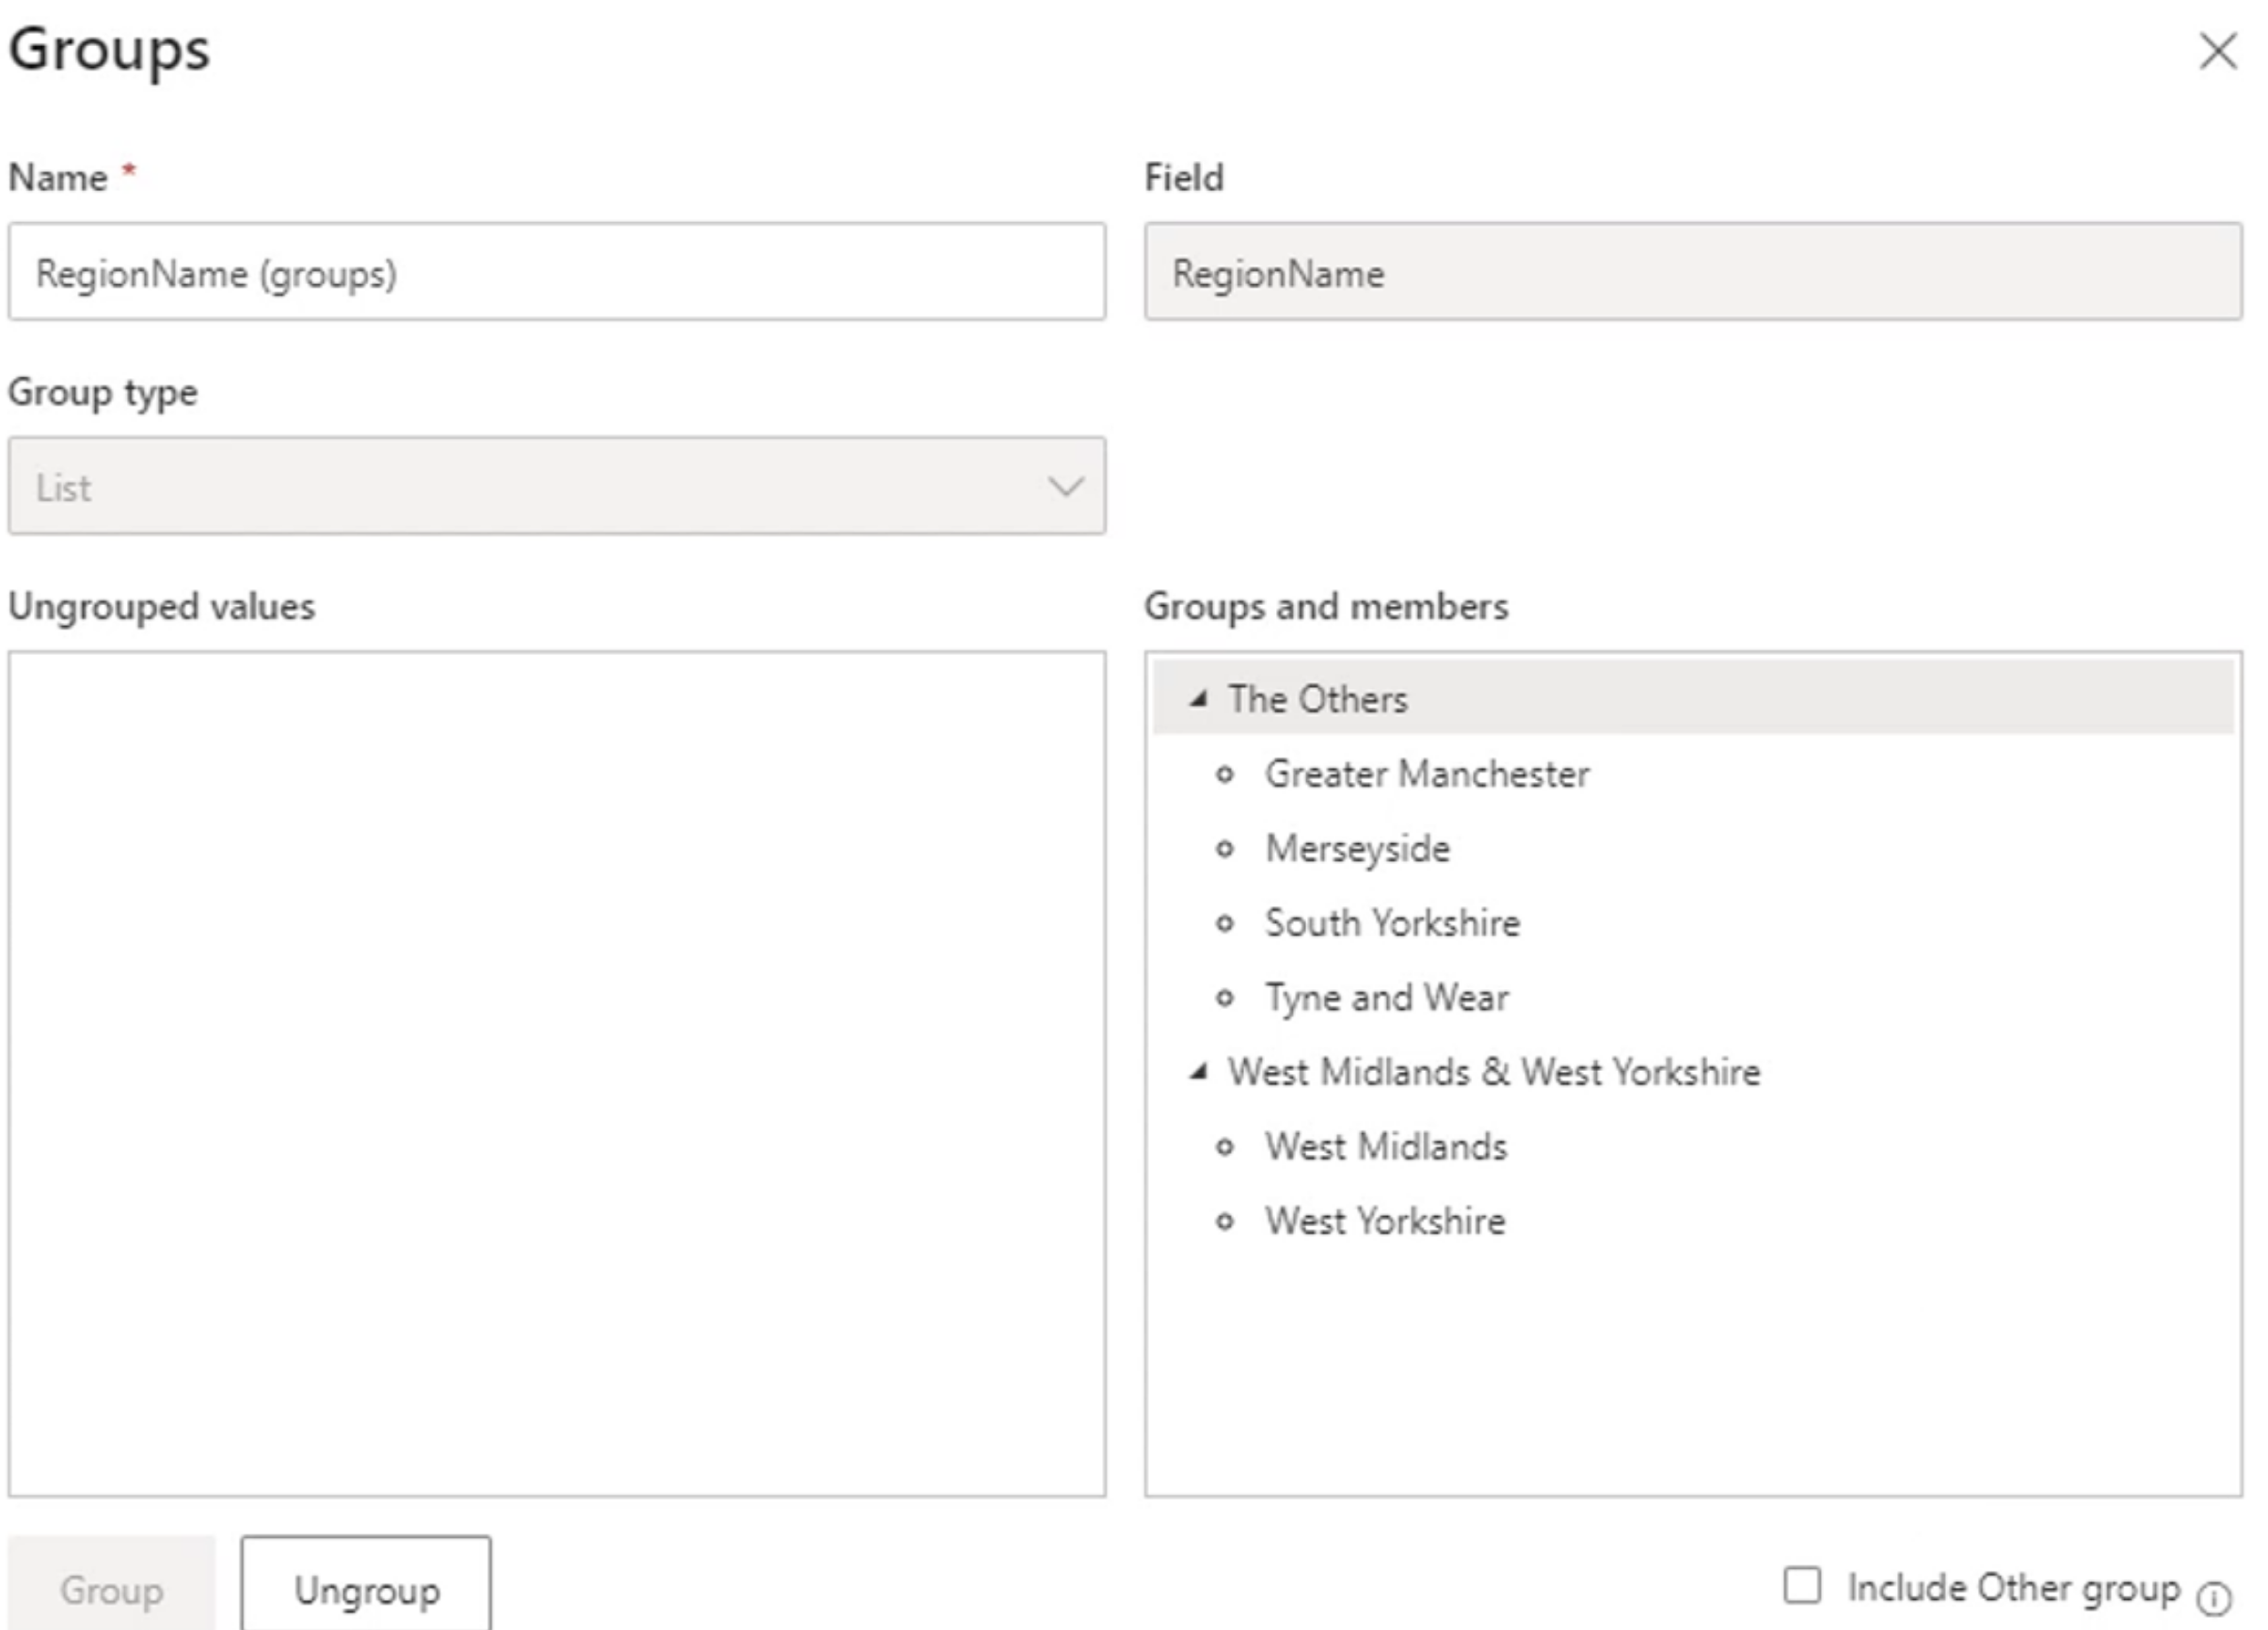
Bins are used to group continuous data into discrete intervals. This can be useful for identifying patterns and trends in your data, particularly when dealing with large datasets. You can create bins based on numerical data, and you can also customize the size and number of bins to suit your needs.
For example, bins of 500 units group values into intervals such as 0-499, 500-999, and 1,000-1,499. This can simplify the analysis and make patterns easier to identify.
Groups and bins serve different purposes:
- Groups combine selected categories, such as combining several small regions into an "Other" group.
- Bins divide numeric or date values into ranges, such as 0-499, 500-999, and 1,000-1,499.
Choose a bin size that supports the business question. Very small bins can create noise, while very large bins can hide meaningful differences. Check the boundaries and labels, especially when values fall exactly on a boundary. Bins are useful in histograms, column charts, and slicers, but they should not replace a continuous chart when the exact trend matters.
Interpreting Patterns Carefully
Pattern-finding features are designed to surface candidates for investigation. They do not automatically prove that a pattern is meaningful or that one field causes another.
When reviewing a result, check:
- the number of records behind the result
- the current filters and slicer selections
- missing values and unusual source records
- whether the pattern appears across more than one period or segment
- whether the result makes sense in the business context
An outlier may be a data-quality problem or an important event. A cluster may describe a useful segment, but the fields and scale used to create it influence the result. An anomaly may be a real incident, a holiday effect, or a change in data collection. Document the interpretation before taking action.
Module 12 Summary
Module 12 covers several ways to discover unusual behavior and organize data for analysis:
- Outliers should be investigated before they are removed or transformed.
- Clustering groups similar points and can help reveal customer or market segments.
- Anomaly detection identifies unexpected points in supported line charts.
- Narratives summarize the current filter context and should be tested with key slicers.
- Groups combine categories, while bins divide continuous values into ranges.
- Analytical results should be validated against source data and business context.