Module 10: Measure Performance
Gauges
Gauges are a great way to visualize progress towards a goal. They provide a clear and intuitive representation of how close you are to achieving a target, making it easy to track performance at a glance. Examples of gauges include speedometers, thermometers, and progress bars. They can be used in a variety of contexts, such as tracking sales targets, monitoring project milestones, or measuring key performance indicators (KPIs).
Cards and multirow cards
Cards and multirow cards are used to display key metrics and important information in a concise and visually appealing way. They are particularly useful for highlighting critical data points, such as total sales, revenue, or customer counts. Cards can be single-value displays, while multirow cards allow for the presentation of multiple metrics in a compact format. They are often used in dashboards to provide quick insights and facilitate decision-making.
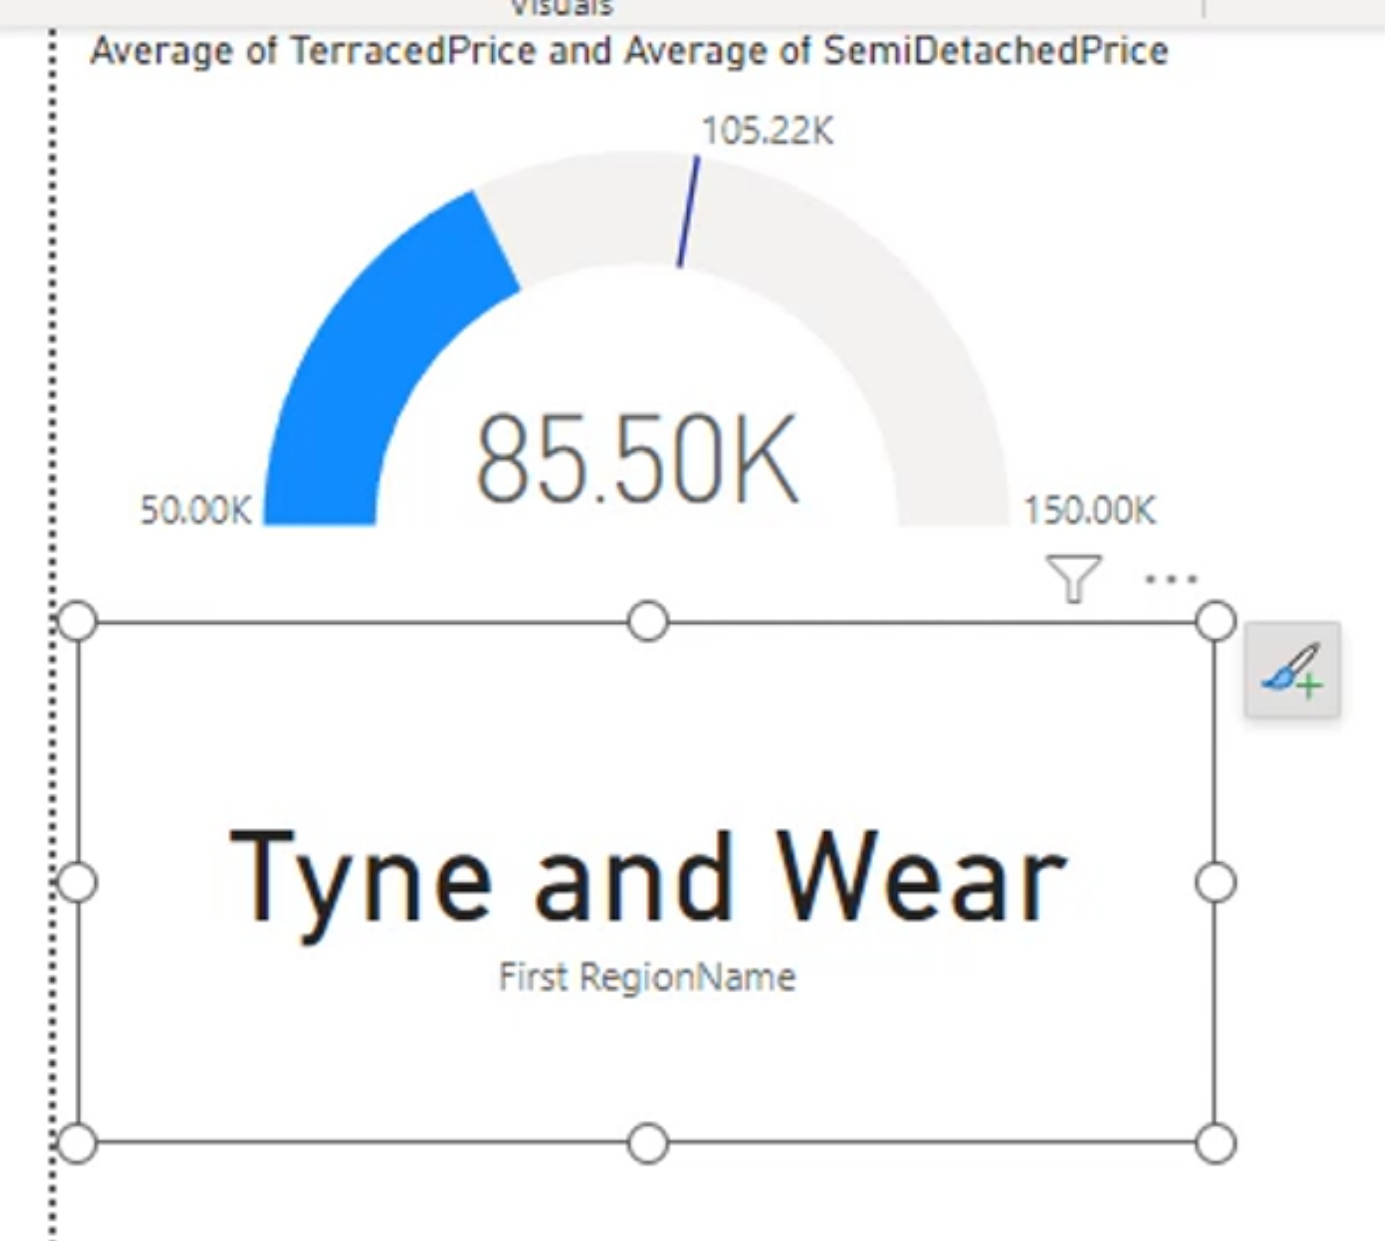
A card with a single name.
What is the highest x might be useful here.
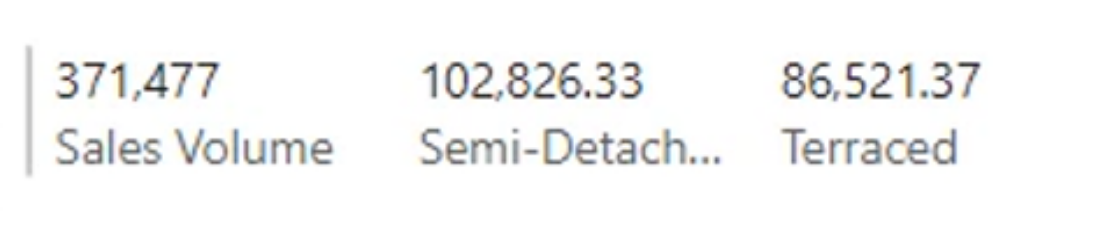
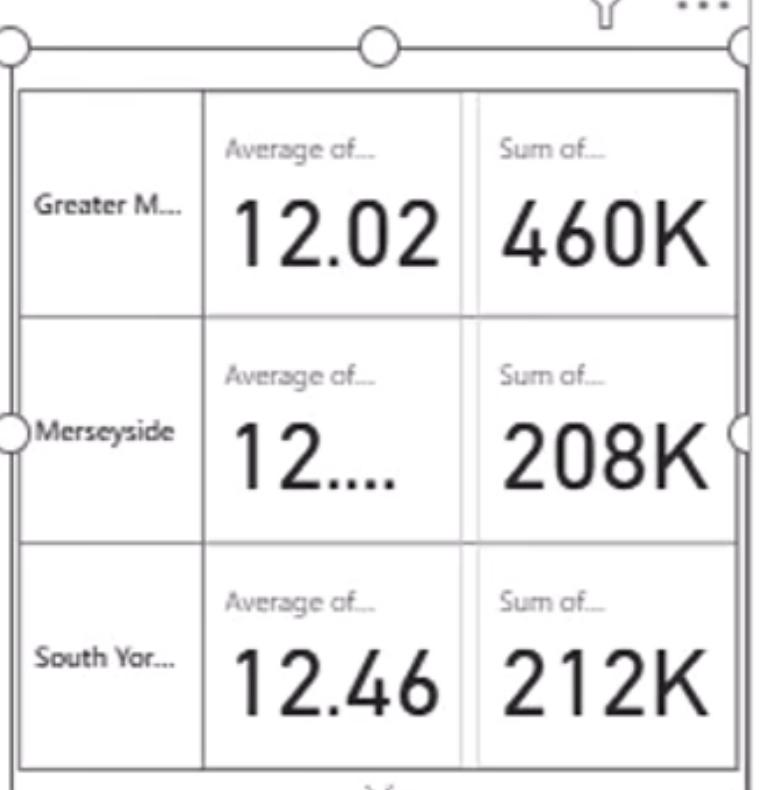
A multirow card with multiples:
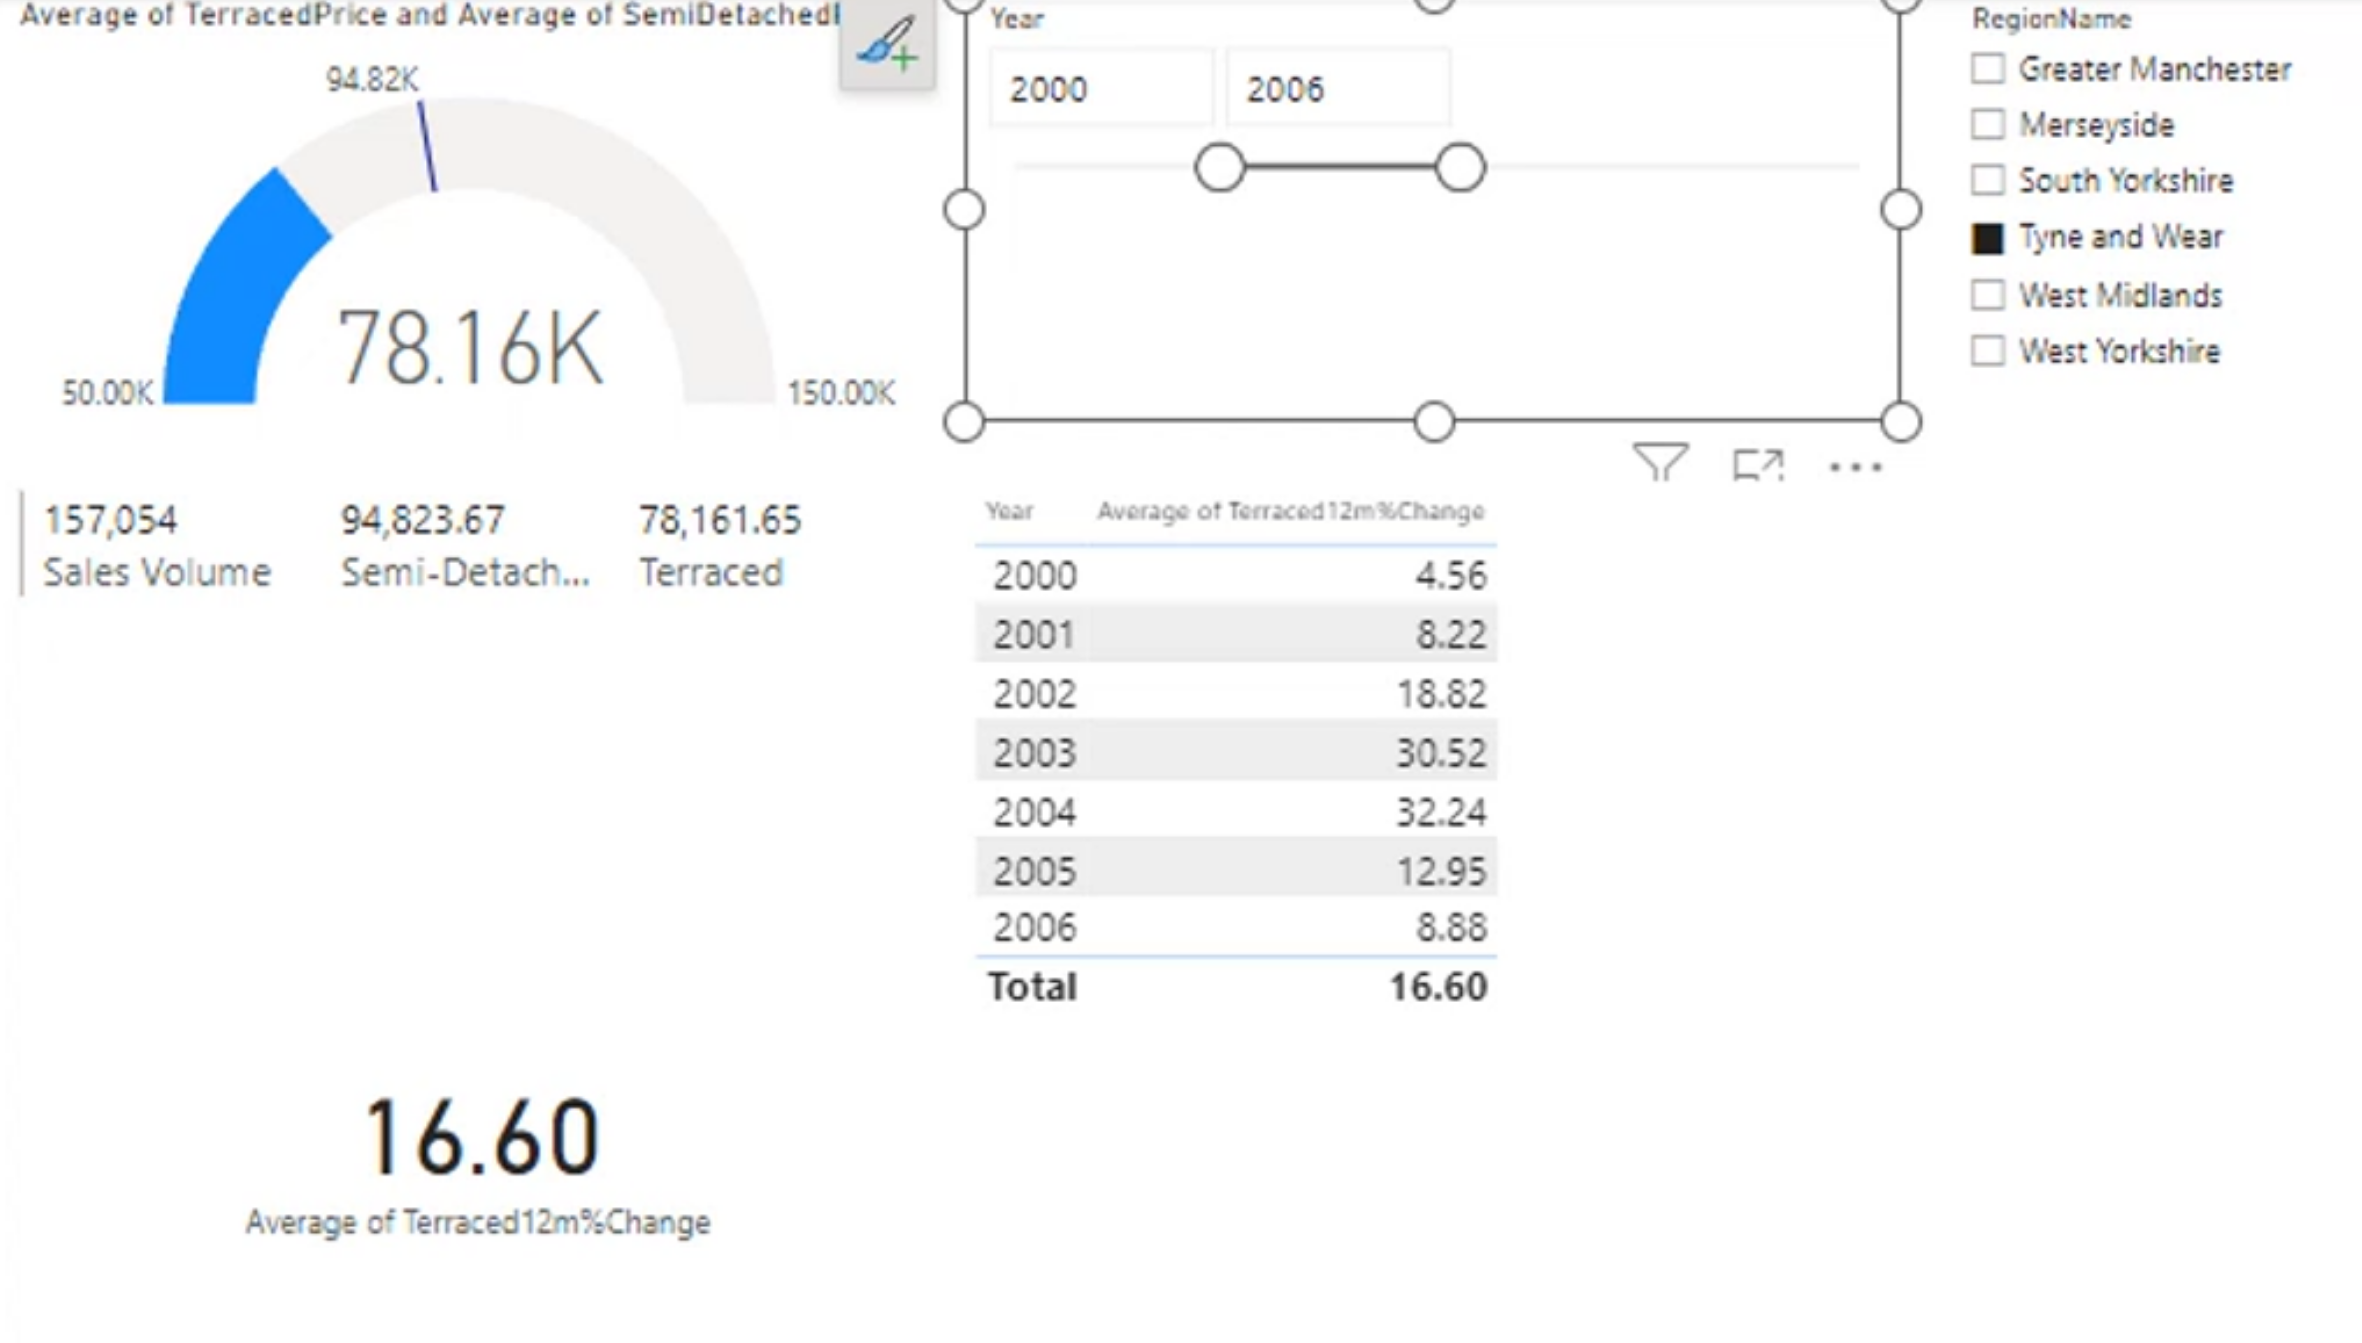
These visuals can be combined into a report layout like this:
More Conditional Formatting
Formatting by rules
For example, apply these rules:
- If the value is between 2 and 10, format it green.
- If the value is above 10, format it red.
- If the value is below 2, format it blue.
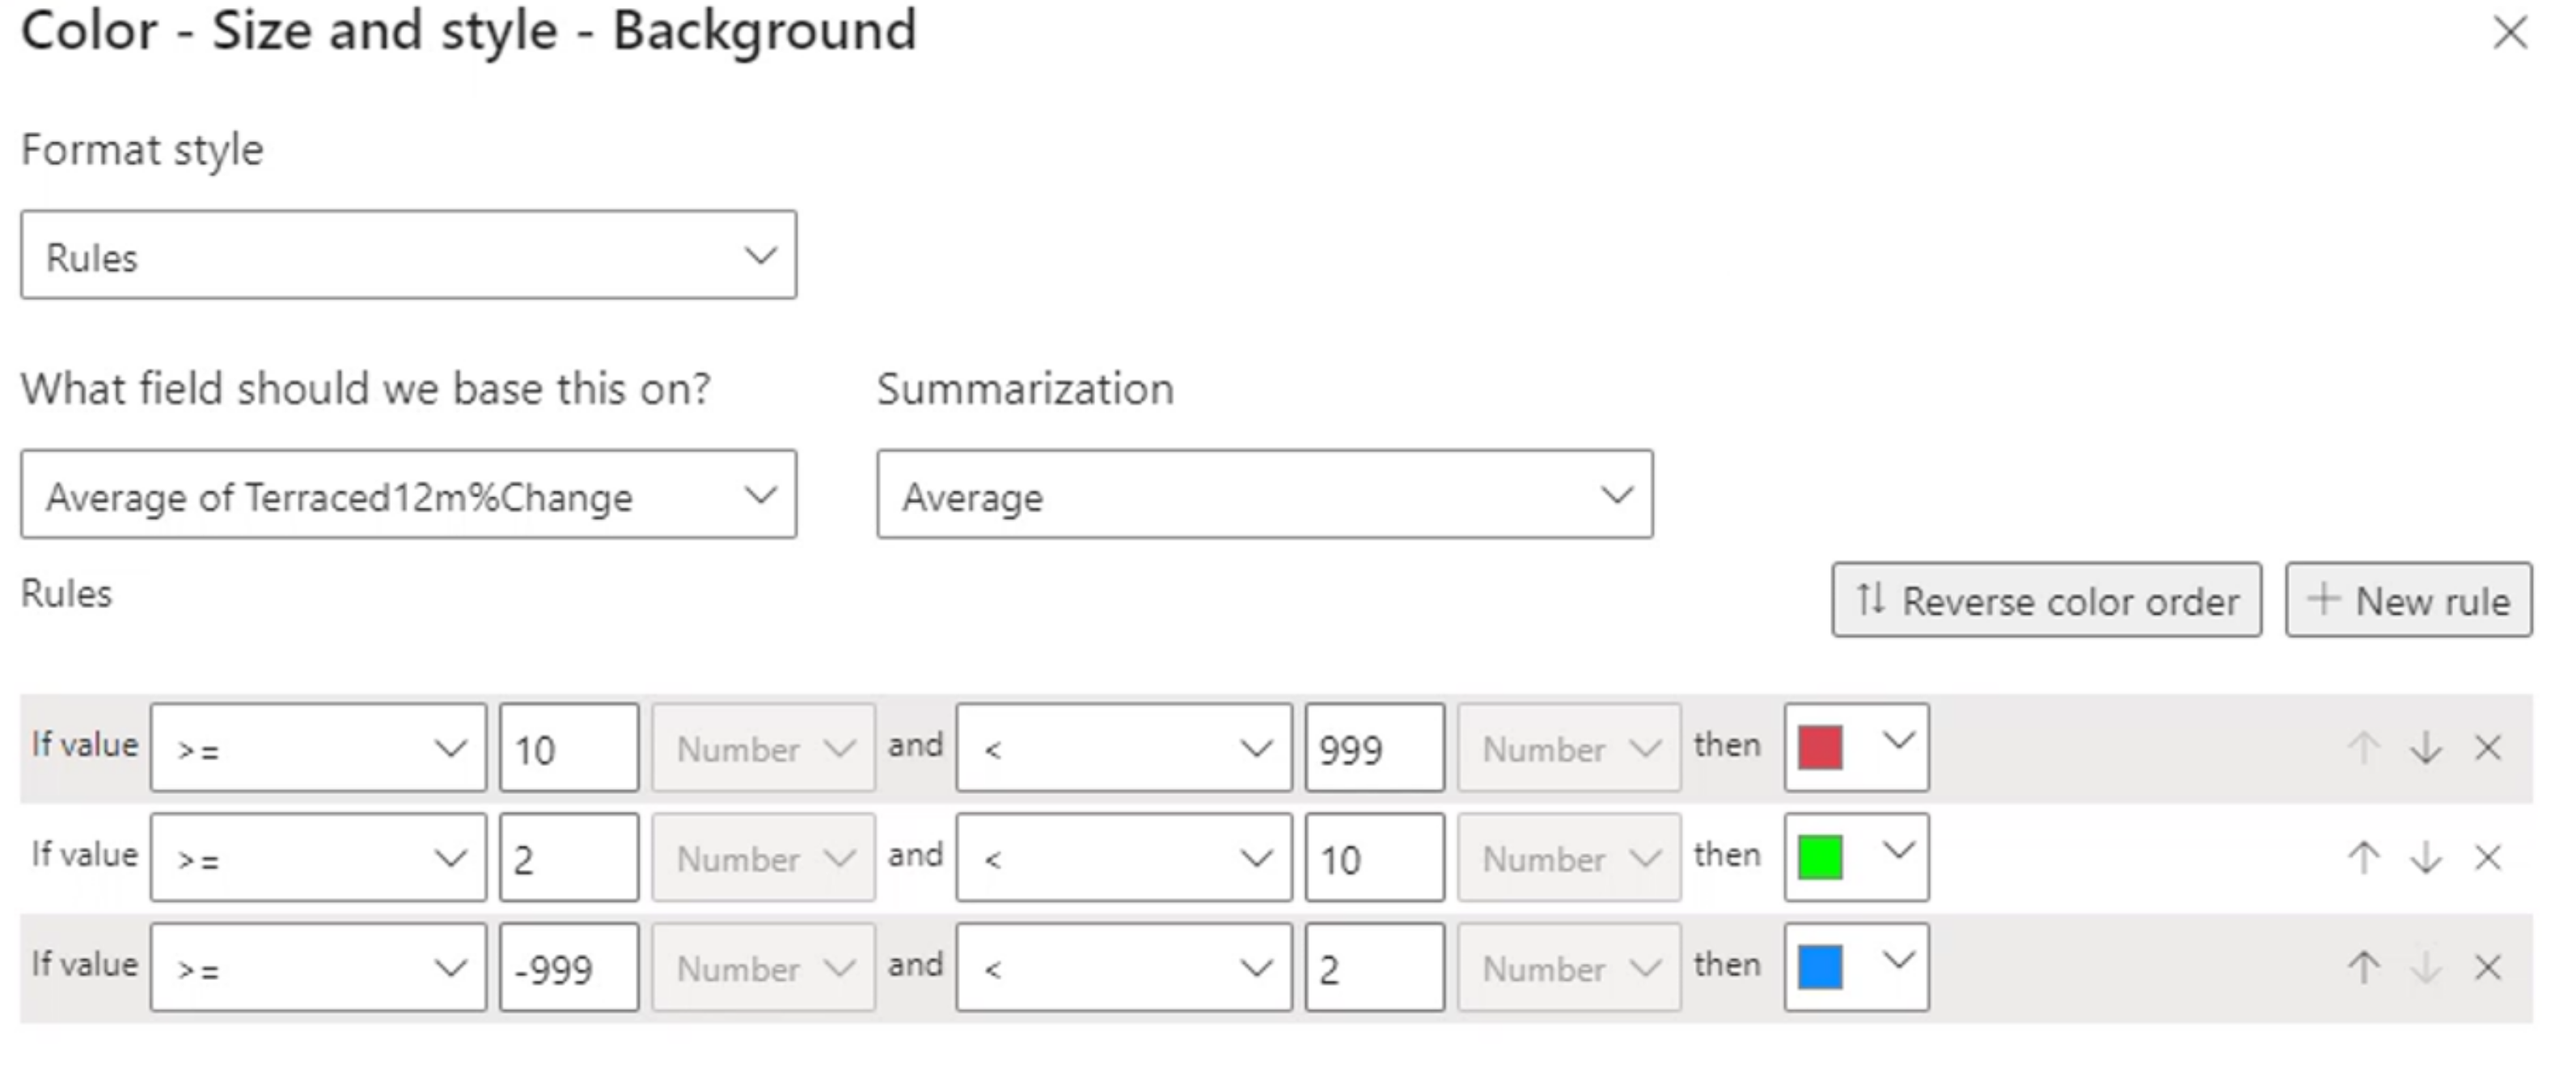
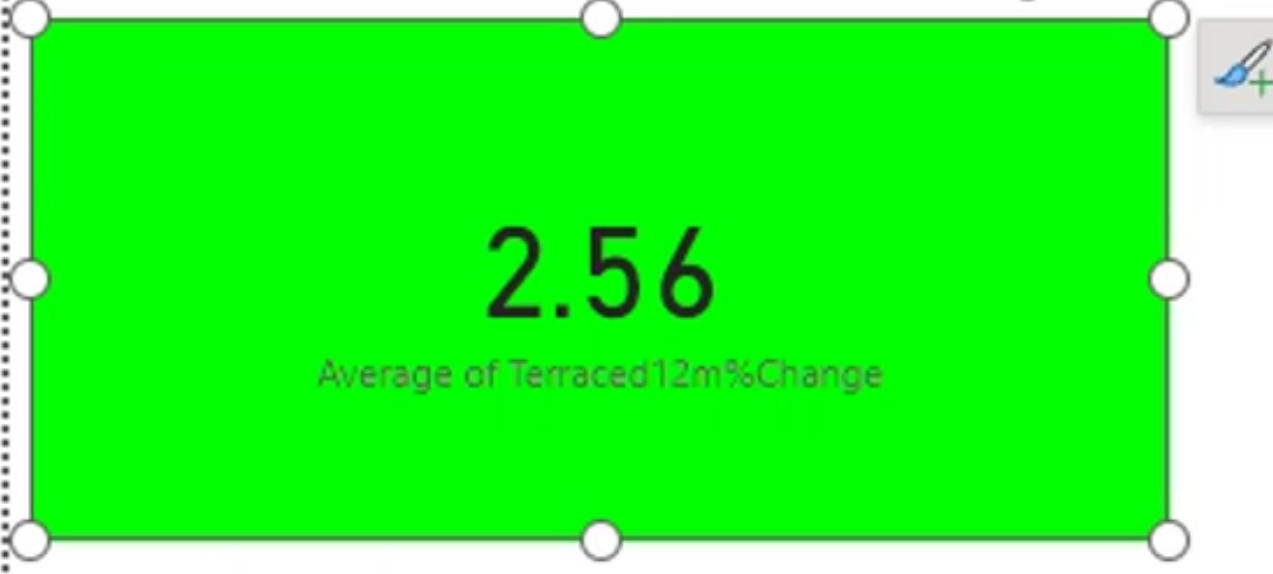 and then you can apply those same rules to different visualizations, like a table or a matrix. You can also apply conditional formatting to the background color of the cells, the font color, or even the data bars within the cells. This allows you to create a more visually engaging and informative report that highlights key insights and trends in your data.
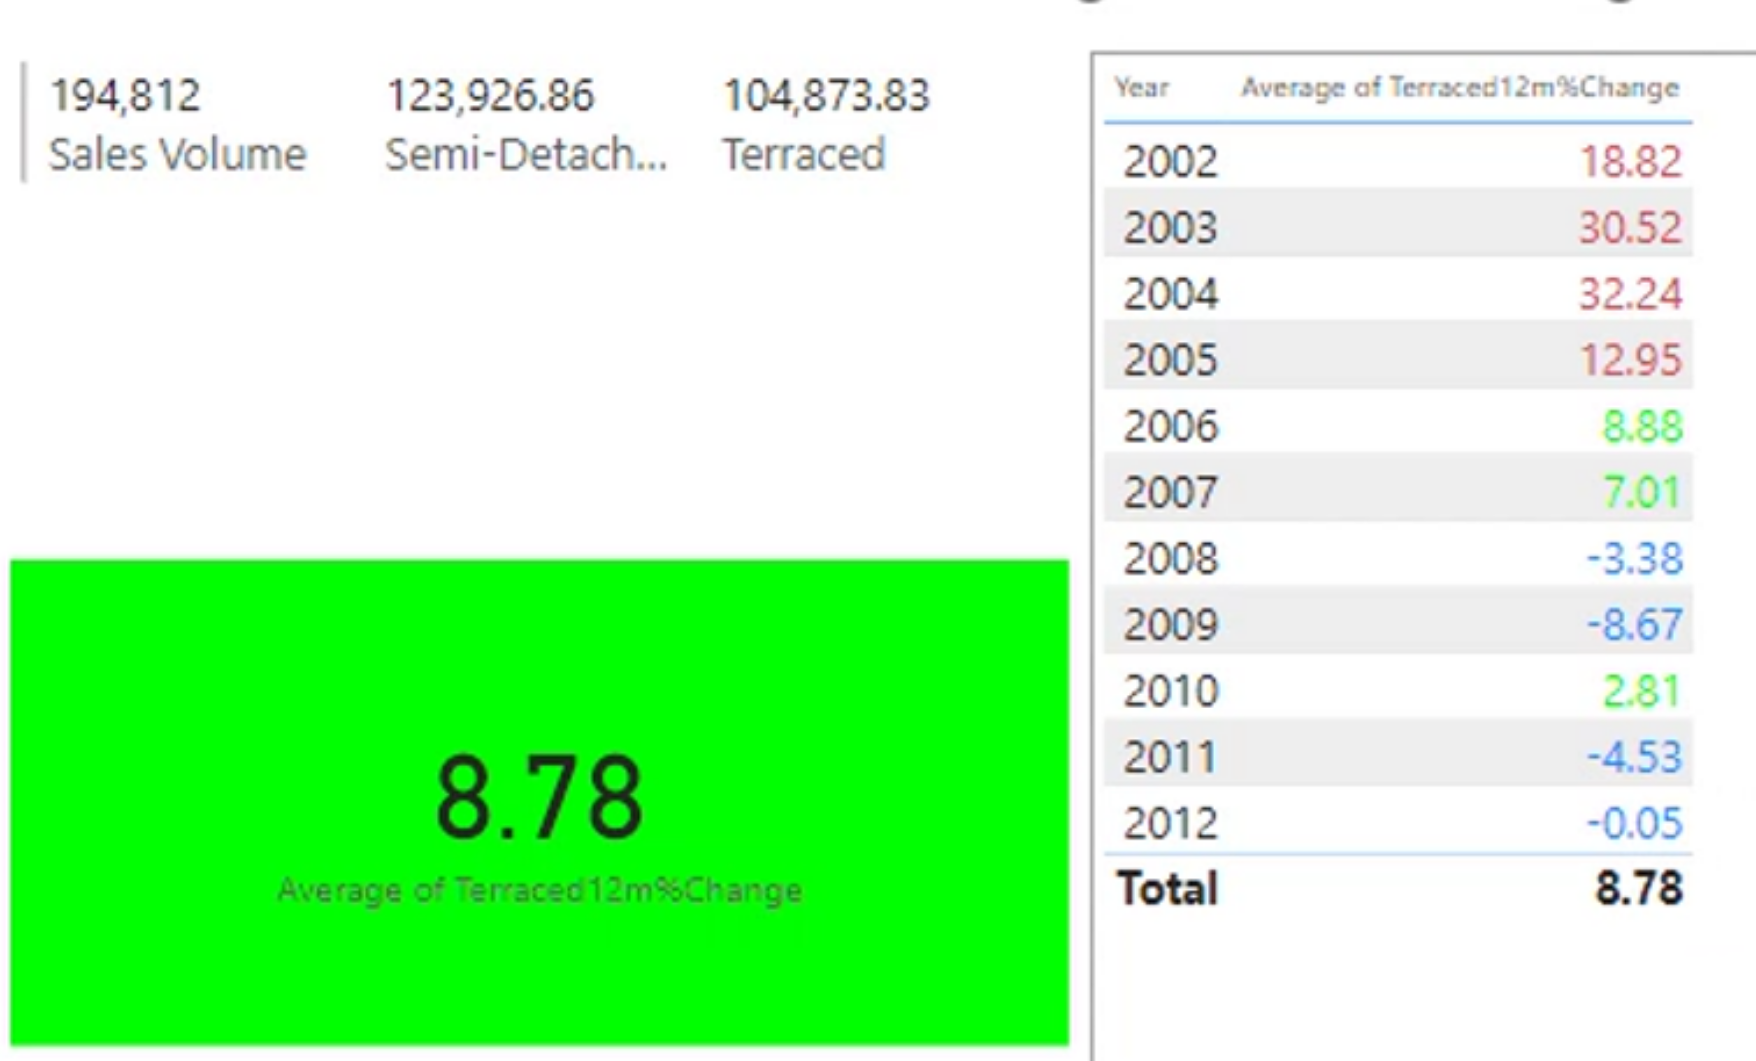
You can also add in icons to your conditional formatting, which can help to further emphasize important data points and make the report more visually appealing. Icons can be used to represent different conditions or thresholds, making it easier for users to quickly interpret the data and identify trends or outliers.
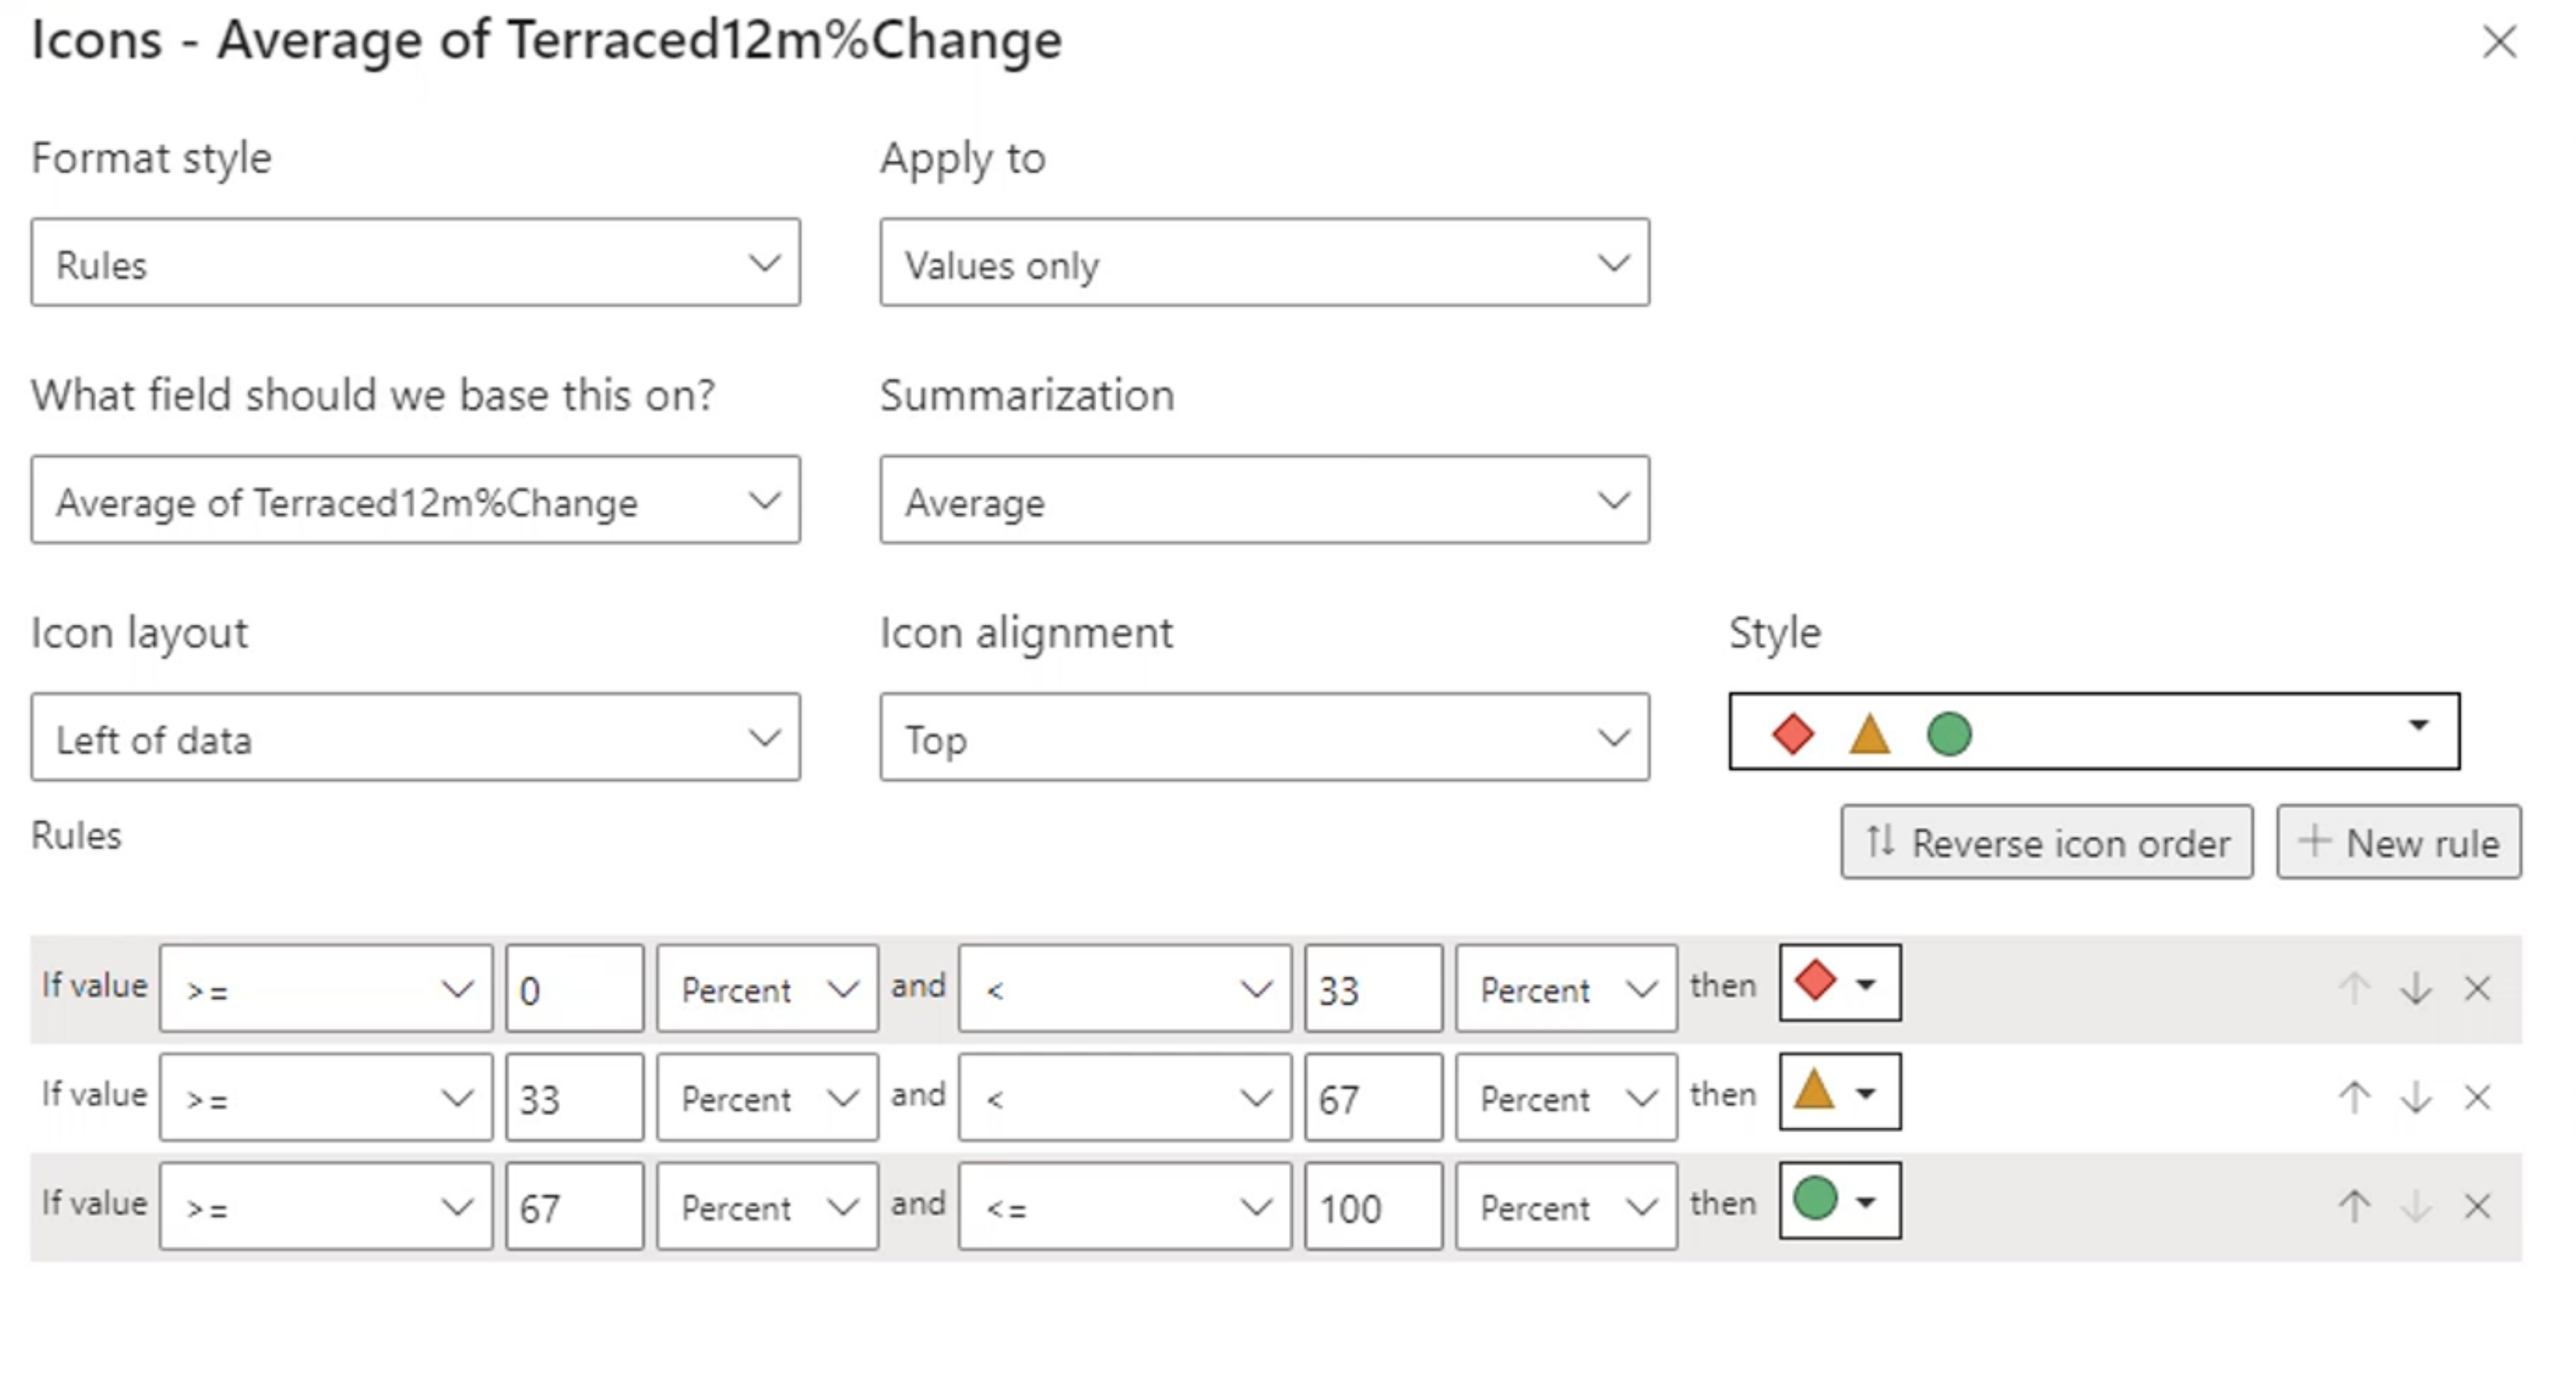
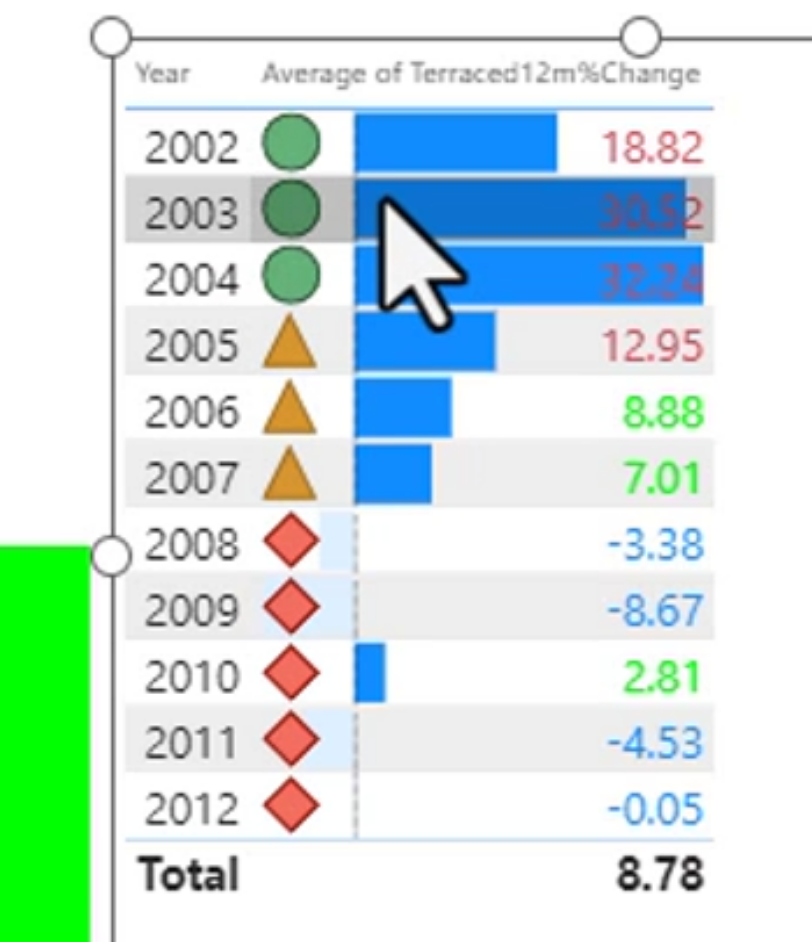
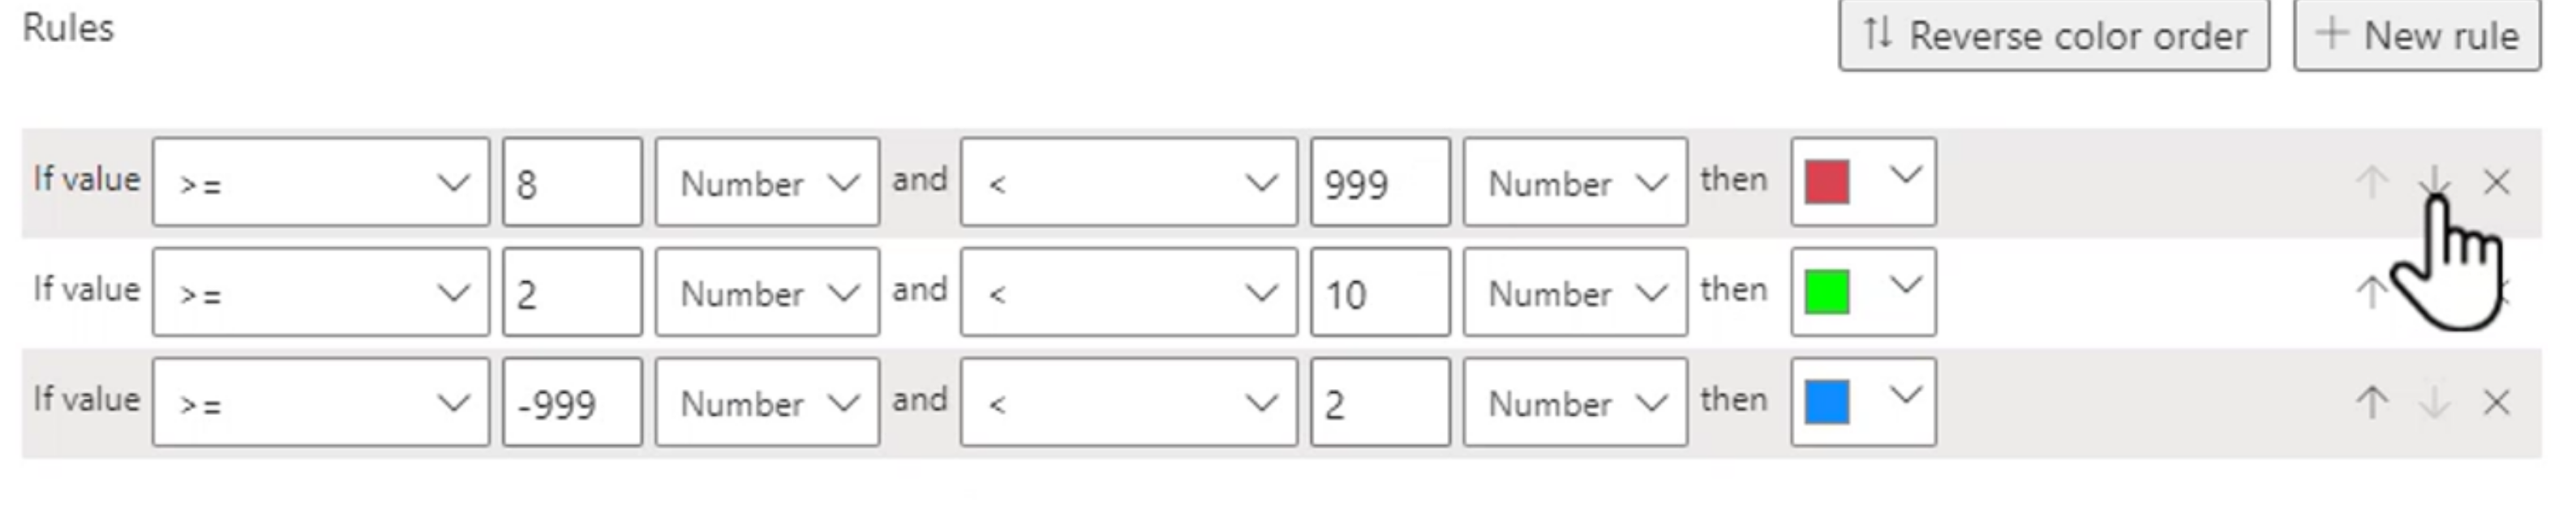
Priority of rules is important. If you have multiple rules that apply to the same data point, Power BI will evaluate the rules in order of priority. The first rule that matches the condition will be applied, and any subsequent rules will be ignored. This means that you need to carefully consider the order of your rules to ensure that the desired formatting is applied correctly.
A value of 9 would be green under these rules. Adjust the rule order or thresholds when the business meaning requires a different classification.
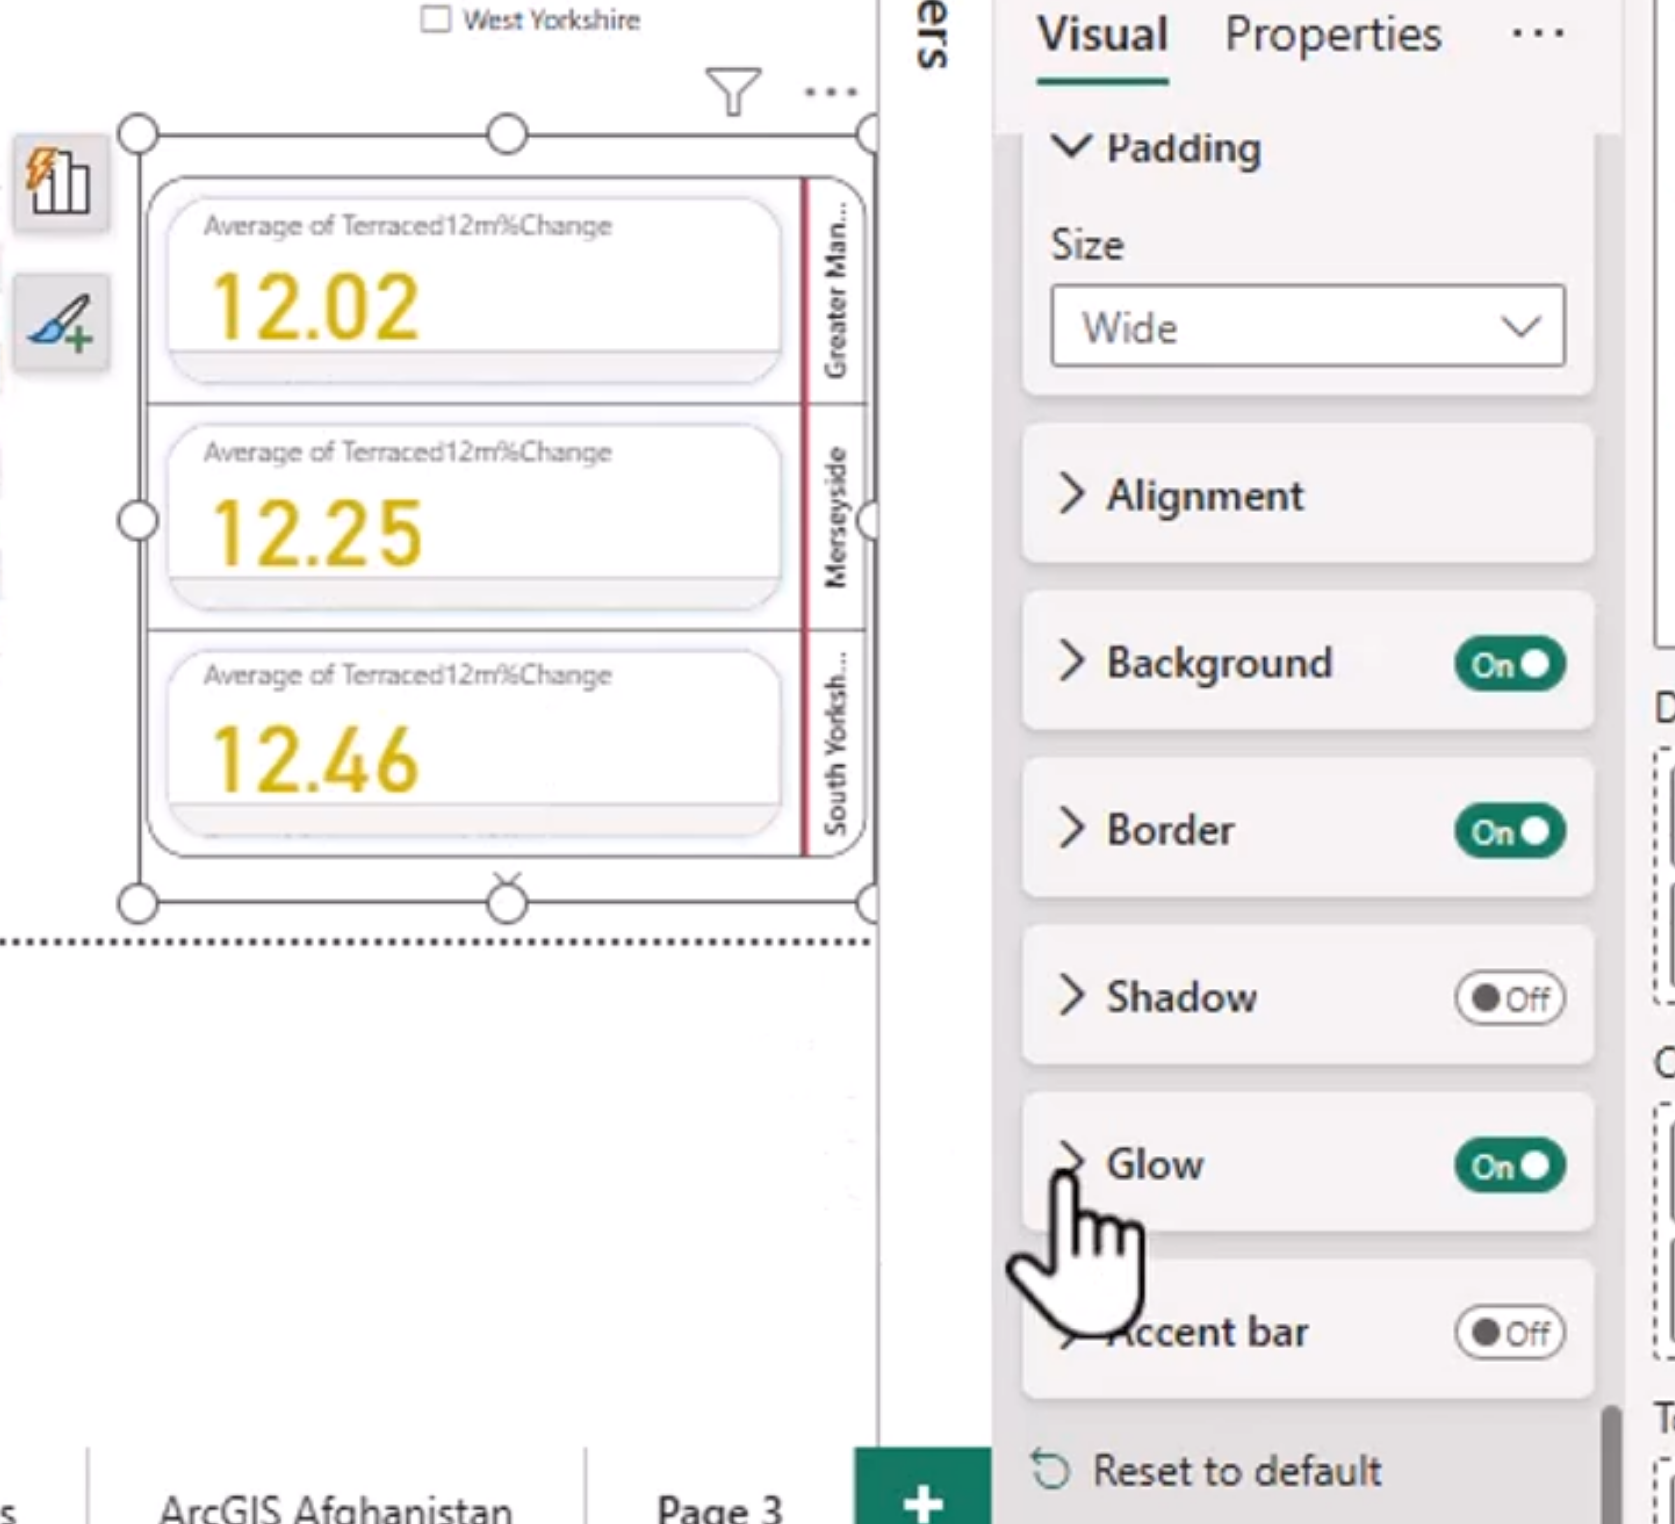
The New Card Visual
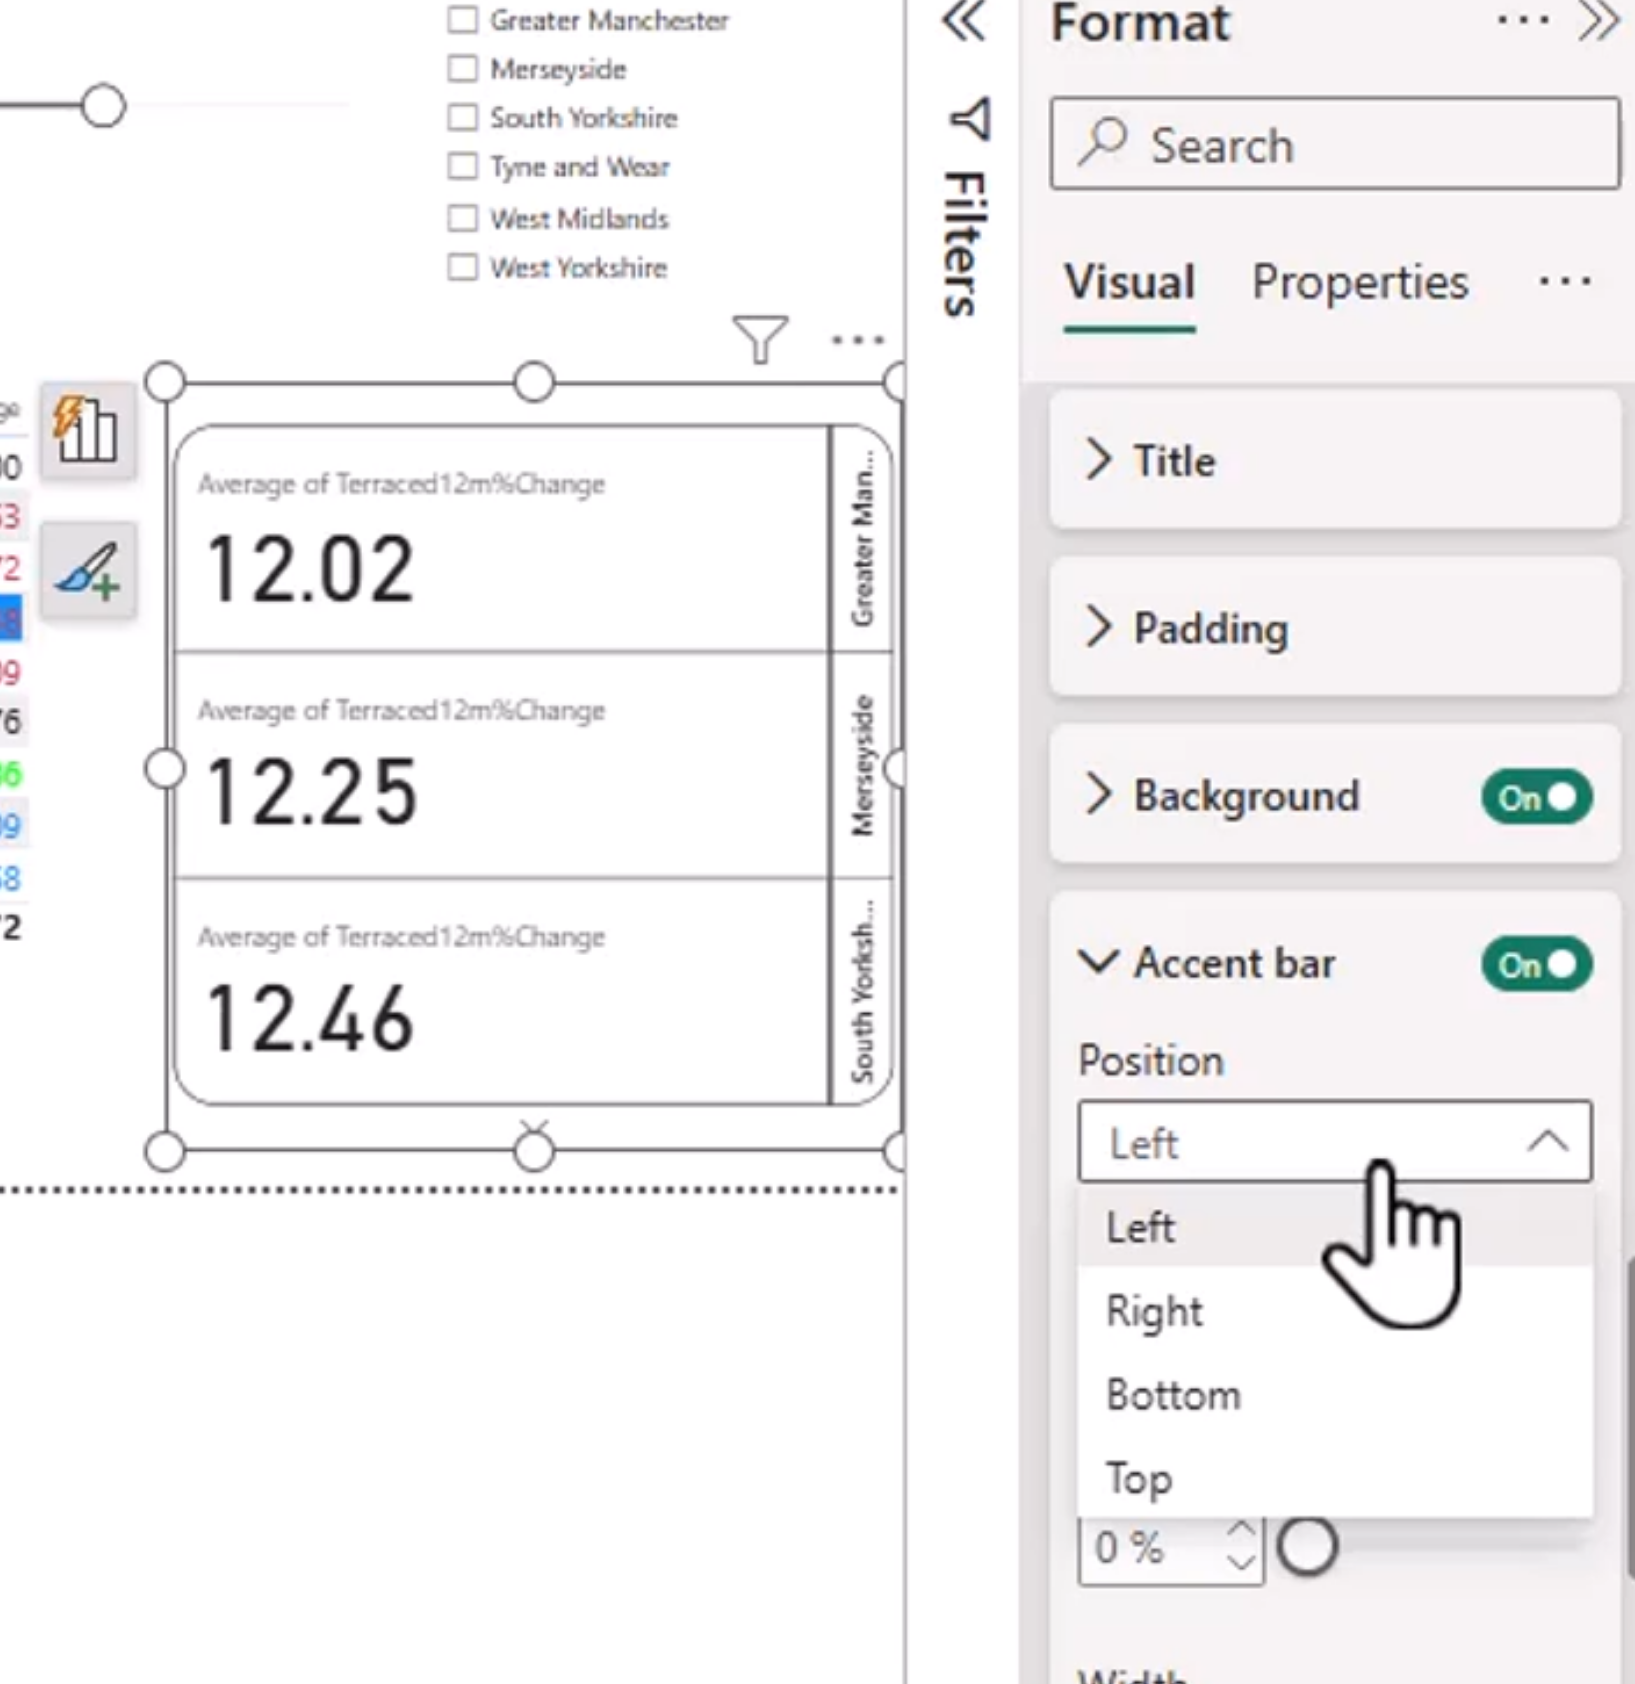
This may be a preview feature still, but it is a new card visual that allows you to display multiple metrics in a single card. This can be useful for providing a quick overview of key performance indicators (KPIs) or other important metrics. The new card visual allows for more customization and flexibility in how the data is presented, making it easier to create visually appealing and informative reports.
Play with the formatting options to make it look like this:
KPIs
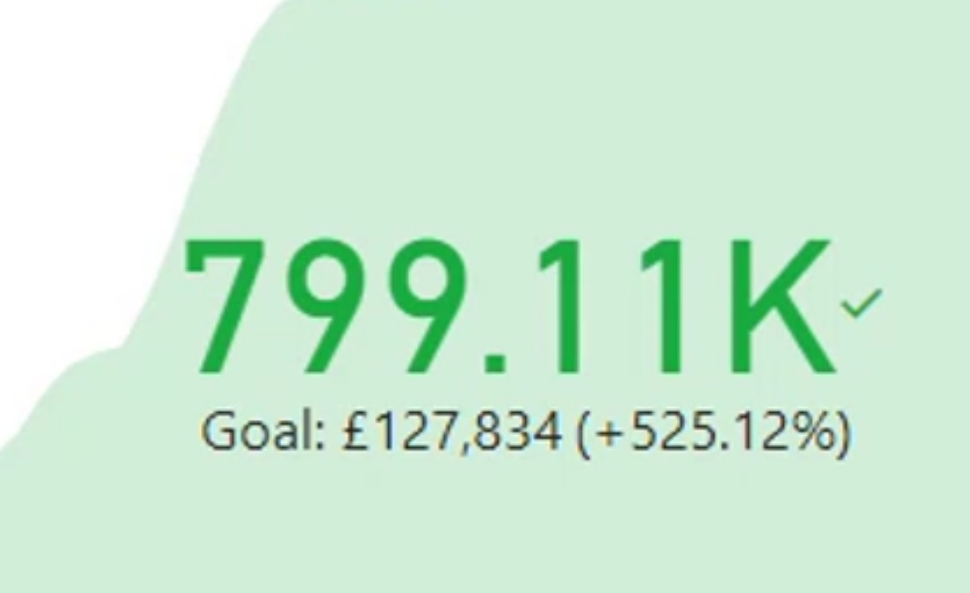
KPIs are a great way to visualize performance against a target. They provide a clear and concise representation of how well you are doing in relation to your goals, making it easy to track progress and identify areas for improvement. KPIs typically include a measure, a target, and an indicator that shows whether the performance is on track, above target, or below target.